

A Mind Map is a method of visually organizing thoughts and information by expanding related words and images outward from a central theme. By creating branches from a central topic and developing further associations from those branches, users can explore a subject from multiple perspectives and gain an overview of its contents.
Mind Maps originally became popular as a method for associative thinking, idea generation, note-taking, and learning. By adding words and images as they come to mind, users can develop their thoughts differently from the way they would when writing a document in a predetermined sequence.
Today, however, an increasing number of Mind Mapping tools can also read existing documents and automatically generate hierarchical visual summaries. They can extract important topics from PDFs, web pages, meeting records, videos, and other sources and present them as Mind Maps.
These two applications use similar visual structures but serve different purposes.
A Mind Map for idea generation expands thoughts that have not yet been fully developed. A Mind Map for summarization organizes existing information to make its overall structure easier to understand.
Understanding this distinction helps clarify when and how Mind Maps should be used.
The Origins of Mind Mapping and Tony Buzan
Tony Buzan (1942–2019), a British author and educator, is widely known for popularizing modern Mind Mapping.
Buzan focused on the limitations of conventional note-taking, in which information is typically recorded linearly from top to bottom. He proposed an alternative approach that used associations, keywords, images, and visual organization to support thinking and memory.
He introduced these ideas to a wider audience through publications including Use Your Head, first published in 1974. He subsequently developed and systematized Mind Mapping further, including through publications with his brother Barry Buzan.
In Buzan’s approach, branches radiate outward from a central image, with keywords, colors, and images used to represent ideas.
Rather than writing lengthy sentences, the method emphasizes concise keywords and visual relationships.
Buzan argued that this approach could improve memory and creativity.
However, the effectiveness of a visual representation should not be confused with a claim that it directly reproduces the information-processing structure of the human brain.
A radial diagram may help people organize and recall information without implying that the brain itself organizes information in the same form.
Furthermore, radial diagrams and visual representations of conceptual relationships existed in various forms before Buzan.
His contribution was to systematize related ideas into a distinctive approach to note-taking and thinking and to popularize that approach internationally.
The Basic Structure of a Mind Map
A Mind Map generally consists of the following elements.
| Element | Function |
|---|---|
| Central Topic | Represents the subject being explored or organized |
| Main Branches | Represent major perspectives related to the central topic |
| Sub-branches | Develop details and associations related to the main branches |
| Keywords | Express information and ideas concisely |
| Colors and Images | Help distinguish, emphasize, and recall information |
| Cross-links | Indicate additional relationships between different branches |
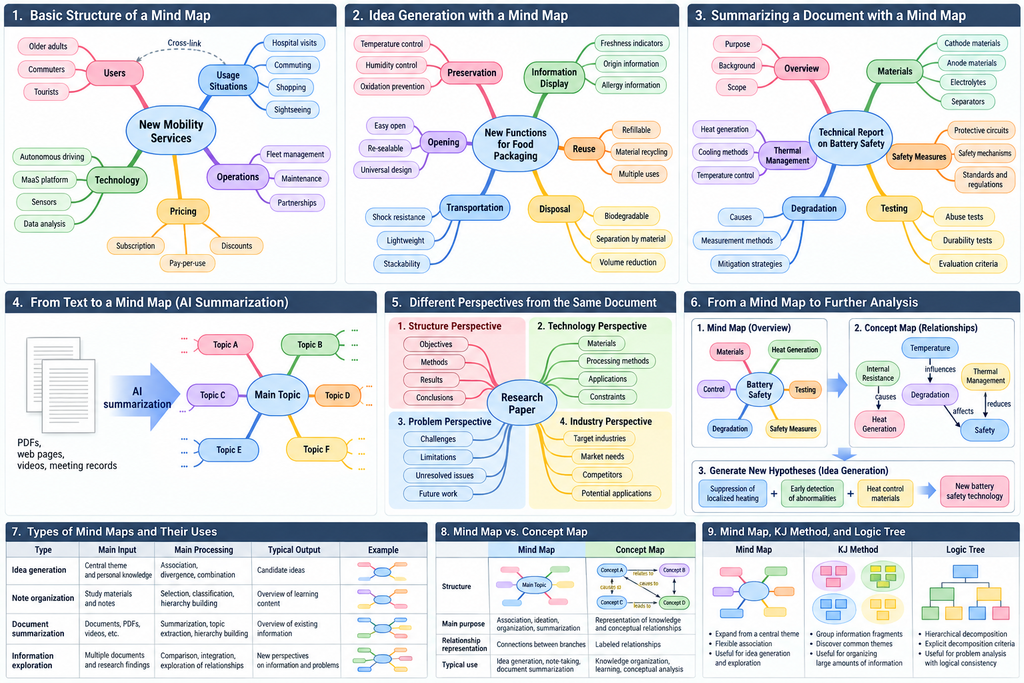
For example, when exploring the theme “New Mobility Services,” the central topic might be connected to branches such as Users, Usage Situations, Technology, Pricing, and Operations.
The Users branch might include older adults, commuters, and tourists.
The Usage Situations branch might include hospital visits, commuting, shopping, and sightseeing.
Additional relationships could be identified between older adults and hospital visits or between tourists and sightseeing.
An important characteristic of Mind Mapping is that users do not need to establish a rigorous classification system at the beginning.
New perspectives can be added as they emerge. Existing branches can be reorganized or moved.
However, branch placement reflects the choices of the person creating the map.
Different people may construct different Mind Maps for the same subject depending on their purposes and interpretations.
1. Mind Maps for Idea Generation
One of the most familiar applications of Mind Mapping is generating ideas through association.
Suppose the central theme is “New Functions for Food Packaging.”
Branches might include Preservation, Transportation, Opening, Disposal, Information Display, and Reuse.
Preservation could lead to Temperature Control, Humidity Control, and Oxidation Prevention.
Information Display might lead to Freshness Indicators, Origin Information, and Allergy Information.
At this stage, there is no need to produce a logically complete classification or a finished product concept.
Instead, the user explores how one word suggests another and how the resulting associations lead to further possibilities.
Hierarchical Decomposition and Free Association
An important characteristic of Mind Maps is that different types of relationships may appear within the same branching structure.
For example, expanding Food Packaging into Materials, Shape, and Cost involves decomposing the subject into components or analytical perspectives.
By contrast, expanding Food Packaging into Insect Shells, Plant Seeds, and Skin involves associations with different objects or systems.
The former resembles classification or decomposition.
The latter resembles associative or analogical thinking.
Mind Maps allow both forms of thinking to coexist within a single diagram.
This flexibility is useful for idea generation, but it requires caution in more rigorous analysis.
Items placed under the same branch do not necessarily belong to the same logical category.
A branch in a Mind Map does not always represent a formally defined logical relationship. Sometimes it simply records the path through which an association emerged.
Using Mind Maps to Expand Ideas
When idea generation is the objective, the basic procedure is to establish a central theme and expand associations outward.
During the initial stage, it may be useful to avoid evaluating classification consistency or technical feasibility too strictly.
The objective is to expand the range of possibilities.
Once a sufficient number of ideas has been generated, duplicates can be consolidated and relationships between items on different branches can be examined.
For example, combining Oxidation Prevention and Freshness Indicators might lead to the idea of packaging materials capable of detecting the condition of their contents.
However, generating such an idea through Mind Mapping does not establish its technical feasibility.
The underlying mechanisms and practical operating conditions must be investigated separately.
2. Mind Maps for Learning and Note Organization
Mind Maps are also used to organize educational materials and reading notes.
For example, when studying statistics, a student might place Statistics at the center and create branches for Descriptive Statistics, Inferential Statistics, Probability, Regression Analysis, and Multivariate Analysis.
Related concepts and methods can then be added to each branch.
This representation helps the student identify where individual topics fit within the broader subject.
In conventional written notes, explanations are generally encountered in a predetermined sequence.
A Mind Map allows multiple topics to be viewed simultaneously, making it easier to recognize major groupings and the overall organization of a subject.
However, converting information into a Mind Map does not necessarily mean that the information has been understood.
For example, placing Multiple Regression and Logistic Regression under Regression Analysis does not demonstrate an understanding of their mathematical principles or conditions of application.
Important equations, assumptions, exceptions, and arguments may also be difficult to express using short keywords alone.
Mind Maps are therefore better understood as supplementary tools for reviewing the overall structure of a subject and creating cues for recalling information, rather than complete replacements for detailed explanations.
Research on Learning Effectiveness
Experimental research has examined the effectiveness of Mind Mapping for learning.
For example, Farrand, Hussain, and Hennessy (2002) compared learning with a Mind Map technique against participants’ preferred study methods among medical students.
The study suggested a memory benefit under certain conditions, although there was uncertainty around the effect and issues relating to motivation were also reported.
A systematic review published online in 2025 examining Mind Maps and Concept Maps in undergraduate medical education found studies reporting improved academic performance as well as studies that did not identify statistically significant differences.
These findings suggest that Mind Mapping may support learning, but they do not establish that it is universally superior to other study methods for all subjects and learners.
Furthermore, creating a Mind Map oneself and viewing a map generated by someone else or by AI involve different cognitive activities.
Their educational effects should not automatically be assumed to be equivalent.
3. Mind Maps for Document Summarization
An increasingly important application of modern Mind Mapping tools is document summarization and information structuring.
For example, an AI system can read a lengthy report, extract its main topics, and generate a hierarchical Mind Map.
Xmind AI provides features for generating editable Mind Maps from text, PDFs, web pages, videos, and other sources.
Mapify similarly promotes the summarization of PDFs, web pages, YouTube videos, meeting records, and other content into Mind Maps.
In these applications, the user is not necessarily expanding associations from a central theme.
Instead, AI organizes existing information and presents an overview in a visual structure.
The Relationship Between Document Summarization and Mind Maps
Suppose a report covers the following subjects:
Market Environment, Competitors, Technology Trends, Business Challenges, and Future Strategies.
An AI system might identify these subjects as main branches and organize the important content of each section into sub-branches.
This representation can be useful for understanding the overall structure of a lengthy document.
However, if the system merely converts the document’s table of contents into a hierarchy, the result is closer to an outline presented in a Mind Map format.
Alternatively, the AI may interpret the document and construct its own categories based on the meaning of the content.
This involves semantic reorganization rather than a simple conversion of headings.
The two processes should be distinguished.
| Application | Main Input | Main Processing | Typical Output |
|---|---|---|---|
| Idea Generation Mind Map | Central theme and personal knowledge | Association, divergence, combination | Candidate ideas |
| Note Organization Mind Map | Study materials and notes | Selection, classification, hierarchy building | Overview of learning content |
| Document Summarization Mind Map | Documents, PDFs, videos, and other content | Summarization, topic extraction, hierarchy building | Overview of existing information |
| Information Exploration Mind Map | Multiple documents and research findings | Comparison, integration, exploration of relationships | New perspectives on information and problems |
Modern AI tools may combine several of these activities.
However, even when they generate similar radial diagrams, there is a substantial difference between merely summarizing existing material and discovering new relationships.
What Is Lost When AI Summarizes Documents?
When AI reduces a lengthy document to short keywords, some information is inevitably lost.
This is not a problem unique to Mind Maps. It is a general characteristic of summarization.
Suppose a technical report states:
“Material A exhibited greater strength than Material B under a particular combination of temperature and processing conditions.”
If an AI system summarizes this as “Material A → High Strength,” important conditions disappear.
The result may create the misleading impression that Material A is generally superior to Material B.
Similarly, a report may describe conflicting research findings, exceptions to proposed explanations, limitations of experiments, or unresolved technical problems.
Such information can easily disappear when a document is condensed into a short visual summary.
The Importance of the Summarization Perspective
When generating a Mind Map from a document, the purpose of summarization matters.
For example, the same research paper can be summarized from several different perspectives:
- Organizing the research objectives, methods, results, and conclusions.
- Extracting the technologies and materials used in the study.
- Comparing the limitations of existing technologies with the characteristics of a proposed method.
- Identifying practical constraints and unresolved technical problems.
- Exploring technological principles that might be applicable in other industries.
The resulting Mind Map changes according to the selected perspective.
A Mind Map therefore does not necessarily represent a single structure that objectively exists within the document.
Different questions can produce different structures from the same information.
When using AI-generated Mind Maps, it is important to consider which information has been emphasized and which information has been omitted.
Users should also be able to return to the original text and its sources when necessary.
4. Creating Mind Maps from Multiple Documents
When summarizing a single document, the structure of that document provides a starting point for organizing information.
However, when integrating multiple documents, there may be no common structure.
For example, suppose a company collects academic papers, patents, product information, and industry news concerning a particular technology.
These materials are written for different purposes and may use different terminology, classifications, and levels of detail.
Integrating them into a single Mind Map requires identifying common concepts and characteristics and organizing relationships among them.
For example, information related to High-Temperature Resistance might be organized according to Materials, Processing Methods, Applications, Constraints, and Research Challenges.
However, these categories represent a particular analytical perspective.
For another purpose, it might be more useful to organize the same information according to technological maturity, target industries, or the problems the technologies are intended to solve.
When automatically generating a Mind Map from a large collection of documents, it is therefore important to clarify the classification criteria underlying the resulting diagram.
Conflicting claims should also be preserved rather than automatically merged into a single simplified statement.
For example, if one study reports that a material has high durability while another finds that it deteriorates under particular conditions, the distinction between those findings may be crucial.
An integrated Mind Map should not conceal such differences merely to produce a cleaner structure.
5. Mind Maps and Concept Maps
Mind Maps are often confused with Concept Maps.
Both represent information and concepts visually, but they emphasize different structures.
A Mind Map generally expands related items outward from a central theme.
A Concept Map emphasizes the relationships between concepts and often makes the meaning of those relationships explicit.
For example, a Mind Map might contain branches connecting Temperature Management with Cooling, Sensors, and Quality.
However, the branches do not necessarily explain how these concepts are related.
A Concept Map might express more specific relationships:
“A temperature sensor measures equipment temperature.”
“A cooling system regulates equipment temperature.”
“Equipment temperature may influence product quality.”
In this way, Concept Maps can represent relationships through explicitly labeled connections.
| Perspective | Mind Map | Concept Map |
|---|---|---|
| Basic Structure | Radial and hierarchical expansion from a central theme | Network of relationships between concepts |
| Main Purpose | Association, ideation, organization, summarization | Representation of knowledge and conceptual relationships |
| Relationship Representation | Connections between branches indicate associations | Types of relationships can be explicitly stated |
| Central Topic | Usually organized around a central topic | Not necessarily limited to a single center |
| Cross-branch Relationships | May be represented through additional connections | Multiple relationships are central to the representation |
| Typical Applications | Ideation, note-taking, document summarization | Knowledge organization, learning, conceptual analysis |
Joseph D. Novak and colleagues made important contributions to the development of Concept Mapping.
A central feature of their approach is the representation of meaningful propositions by connecting concepts with linking phrases.
However, modern Mind Mapping software may also support cross-links, labels, and other ways of expressing relationships.
In practice, the capabilities of Mind Mapping and Concept Mapping tools sometimes overlap.
The important distinction is not simply the name of the diagram, but what kinds of relationships it can represent and whether those representations are suitable for the intended analysis.
6. Mind Maps, the KJ Method, and Logic Trees
Mind Maps also share characteristics with other information-organization methods.
The KJ Method organizes fragments of collected information into meaningful groups through comparison and interpretation.
Mind Mapping generally begins with a central theme and expands related items outward.
Thus, Mind Maps may be particularly useful when exploring ideas from a known starting point, while the KJ Method may be useful when discovering groupings among numerous information fragments.
However, the distinction is not absolute.
Mind Map branches can be reorganized, and groups developed through the KJ Method can become starting points for further ideation.
Logic Trees are used to decompose problems or subjects according to defined analytical relationships.
For example, revenue can be decomposed into transaction count and average transaction value through a mathematical relationship.
By contrast, branches in a Mind Map may represent classifications, associations, examples, or possible causes without distinguishing among them.
When logical decomposition is the primary objective, a Logic Tree may be more appropriate.
When exploratory association is the objective, a Mind Map may be more suitable.
| Method | Main Direction of Thinking | Characteristic |
|---|---|---|
| Mind Map | Expanding outward from a central theme | Flexible association and idea generation |
| KJ Method | Forming groups from fragments of information | Comparison and grouping of information |
| Logic Tree | Hierarchical decomposition of a problem | Explicit decomposition criteria and logical consistency |
| Concept Map | Connecting concepts through relationships | Explicit representation of relationship meanings |
These methods are not mutually exclusive.
For example, ideas generated through Mind Mapping can be grouped using the KJ Method, and the resulting concepts can be connected through a Concept Map.
However, combining multiple techniques should not become an objective in itself.
The appropriate method should be selected according to what the user needs to understand or accomplish.
Benefits and Limitations of Mind Maps
Mind Maps have several practical advantages.
They can make the overall structure of a subject easier to see, allow new information to be added quickly, and provide a visual record of how ideas develop.
However, they also have important limitations.
1. Limited Representation of Relationships
Radial branching is well suited to showing central topics, subtopics, and hierarchical associations.
However, many real-world problems involve causal relationships, interactions, and feedback loops among different elements.
For example, manufacturing costs, product quality, and production volume may influence one another.
A simple hierarchical structure may not adequately represent these relationships.
Concept Maps, Causal Loop Diagrams, or mathematical models may be more appropriate in such situations.
2. Inconsistent Classification Criteria
When different kinds of items are placed at the same hierarchical level, a Mind Map may appear organized without being conceptually consistent.
For example, suppose Product Development is connected to Materials, Customers, Quality, and Cost Reduction.
These items represent different types of concepts: components, stakeholders, evaluation criteria, and objectives.
This mixture may be acceptable for free association.
However, when the diagram is used for systematic analysis, the meanings of the categories and the criteria used to organize them should be examined.
3. Reduced Readability at Large Scales
Small Mind Maps can provide a useful overview.
However, as the number of branches increases, the structure may become difficult to navigate.
Even when software provides folding, zooming, and other navigation functions, the amount of information that can be viewed and understood simultaneously remains limited.
For large information collections, hierarchical summaries may need to be combined with search, classification, and alternative views.
4. Visual Organization Does Not Guarantee Understanding
AI-generated Mind Maps can produce visually polished diagrams very quickly.
However, a well-organized diagram does not necessarily preserve the important meanings of the original material.
Incorrect classifications and misleading summaries may appear convincing when presented in a clean visual structure.
Users should therefore compare the generated content with original sources and check whether important assumptions, conditions, and exceptions have been lost.
How AI Is Changing Mind Mapping
Traditional Mind Mapping primarily helped people externalize and organize their own thoughts.
AI-powered Mind Mapping can also organize information extracted automatically from documents and other data sources.
This expands the range of possible applications.
For example, users can quickly obtain an overview of lengthy documents or identify major topics across multiple information sources.
AI may also suggest additional branches when asked to explore further possibilities related to an existing topic.
However, two fundamentally different processes may be involved.
The first extracts and summarizes information already present in the source material.
The second generates new explanations or ideas that are not explicitly stated in the source.
For example, extracting High-Temperature Materials, Surface Treatments, and Manufacturing Processes from a technical report differs from proposing a new application by combining those concepts.
The former is information organization.
The latter is hypothesis generation.
Furthermore, determining whether the newly proposed hypothesis is feasible requires additional investigation and verification.
When using AI-generated Mind Maps, it is therefore important to distinguish summarization of existing information, reclassification of information, and generation of new hypotheses.
Practical Example — Creating a Mind Map from a Technical Report
Suppose a company wants to organize a technical report concerning the safety of rechargeable batteries.
The report discusses battery materials, heat generation, temperature management, protective circuits, degradation, and testing methods.
A Mind Map for Document Summarization
First, the main topics of the report are extracted.
Battery Safety is placed at the center, with branches such as Materials, Heat Generation, Control, Testing, and Safety Measures.
This provides an overview of the report.
However, the relationships among these topics remain largely unspecified.
A Concept Map for Examining Relationships
The next step may involve identifying more specific relationships.
For example:
“Internal resistance is related to heat generation.”
“Temperature management influences degradation.”
“Protective circuits are used to respond to abnormal conditions.”
The validity and operating conditions of these relationships should be examined against the original report.
At this stage, a Concept Map may be more suitable than a conventional Mind Map.
Generating New Hypotheses
If the objective is to explore alternative technologies for improving battery safety, the problem can be considered at a more abstract level.
Possible directions might include suppressing localized heating, detecting abnormalities at an early stage, or controlling the transfer of heat.
Similar principles could then be explored in other industries or natural systems.
The investigation has now progressed from information organization to analogy and hypothesis generation.
However, the generation of a new technological hypothesis does not establish its feasibility.
This example distinguishes three activities:
Summarizing existing information, analyzing relationships, and exploring new possibilities.
Although they can be connected within a single workflow, they require different forms of reasoning and evaluation.
Mind Maps in ThinkNavi
ThinkNavi treats Mind Mapping as a method for supporting associative thinking and the visual organization of information.
Mind Maps are relatively easy to understand and operate, making them an accessible starting point for people unfamiliar with thinking-support tools.
However, their basic structure is radial and hierarchical.
This creates limitations when representing complex relationships among concepts or knowledge structures that span multiple information sources.
ThinkNavi therefore considers Mind Mapping not only as an individual technique but also in relation to Concept Maps, the KJ Method, Logic Trees, analogy, and hypothesis generation.
For example, Mind Mapping can be used to expand associations from a central topic.
KJ-style grouping may be useful when information needs to be classified.
Concept Maps may be more appropriate when the relationships between concepts must be expressed explicitly.
Further analysis of relationships among concepts may lead to the exploration of new hypotheses.
With AI assistance, possible functions include generating Mind Maps from document summaries, changing the perspective used for summarization, comparing alternative structures, and tracing summarized information back to its original sources.
Other possible directions include classifying concepts extracted from large collections of information according to different perspectives and exploring relationships that cannot be adequately represented by a hierarchy.
These are potential directions for future development and do not imply that all such functions are currently available.
The value of Mind Mapping does not necessarily lie in producing an attractive radial diagram.
When used for ideation, its value lies in allowing people to expand their thoughts without prematurely restricting their associations.
When used for document summarization, its value lies in making the overall structure of information easier to understand.
When deeper analysis is required, other forms of representation and analytical methods can be introduced.
Mind Maps are not universal structures capable of representing every aspect of thought and information. However, they provide an accessible starting point for exploring ideas, expanding associations, and understanding the overall structure of a subject.
Related Topics
- Brainstorming — Generating More Ideas by Suspending Judgment
- SCAMPER | Generating New Ideas Through Seven Perspectives
- Analogy and Structure-Mapping Theory
- The KJ Method | Building Meaningful Structures from Fragmented Information
- Concept Maps
- Logic Trees and Issue Trees
- Problem Structuring — Breaking Down Problems, Understanding Relationships, and Finding Paths to Solutions
- Concept Formation | How Categories Are Made
- IInduction, Deduction, and Abduction — Discovering Patterns, Drawing Conclusions, and Generating New Hypothese
- Critical Thinking | Examining Claims and Evidence
- Systems Thinking | Interdependence and Change Over Time
- Qualitative and Quantitative Thinking — Two Perspectives on Understanding the World and Their Integration
- Concept Exploration
References and Further Reading
Mapify — AI Mind Map Summarizer
Tony Buzan, Use Your Head, BBC, 1974.
Tony Buzan and Barry Buzan, The Mind Map Book, BBC Books, 1993.
Tony Buzan, Mind Map Mastery, Watkins Publishing, 2018.
Paul Farrand, Fearzana Hussain, and Enid Hennessy, “The Efficacy of the ‘Mind Map’ Study Technique,” Medical Education, 36(5), 2002, pp. 426–431.
Husam Aljamal et al., “Efficacy of Mind Maps and Concept Maps in Enhancing Academic Performance Among Undergraduate Medical Students in the Preclinical Stage: A Systematic Review,” Advances in Health Sciences Education, published online 2025.
Joseph D. Novak and Alberto J. Cañas, “The Theory Underlying Concept Maps and How to Construct and Use Them,” Institute for Human and Machine Cognition.