

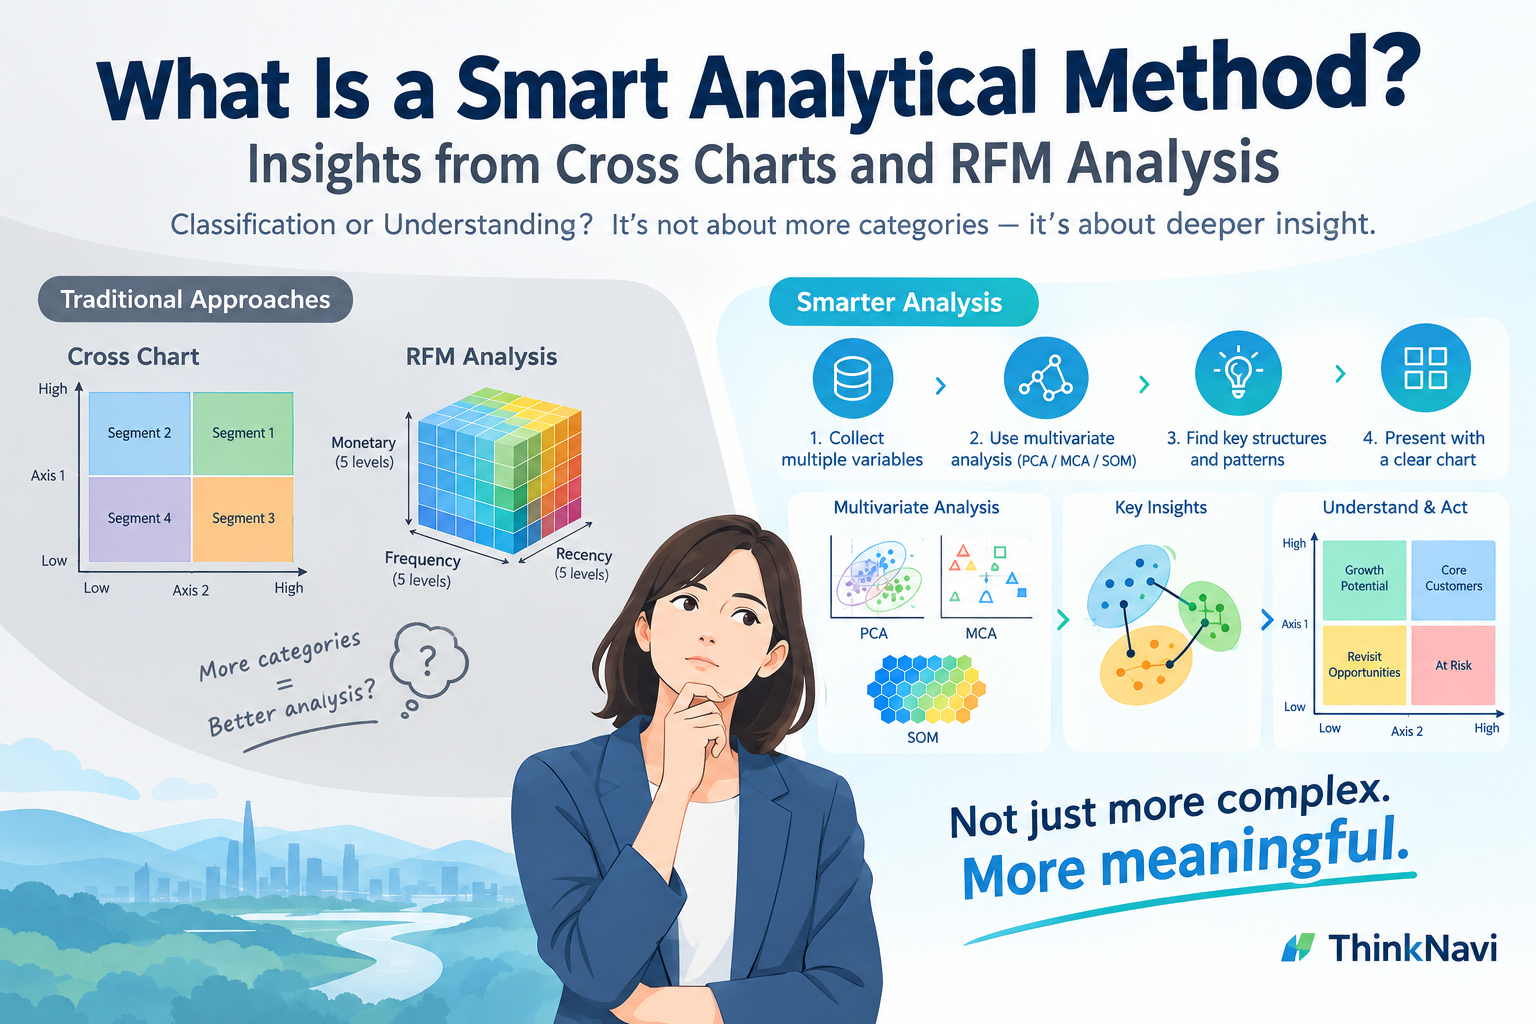

Why more categories and more complex diagrams do not necessarily lead to deeper understanding.
Does More Detailed Classification Mean Better Analysis?
Business professionals use many analytical methods to understand complex situations and support decision-making. Two-axis matrices, portfolio analysis, RFM analysis, and customer segmentation are familiar examples.
These methods share a common characteristic: they classify complex objects or situations according to a limited number of criteria.
For example, a typical cross chart, or two-axis matrix, divides objects into four quadrants based on two evaluation criteria. If four categories seem insufficient, the matrix can be expanded into nine categories by dividing each axis into three levels. Alternatively, a third dimension can be introduced to create eight categories.
In customer segmentation, RFM analysis uses three purchasing indicators. If each indicator is divided into five levels, the result is 125 possible customer segments.
Such increasingly detailed classifications may appear sophisticated and precise.
But do they actually lead to a deeper understanding of the subjects being analyzed?
Increasing the number of categories is not necessarily the same as increasing our understanding of the underlying structure.
This distinction raises an important question about what makes an analytical method truly intelligent.
1. The Structural Limitations of Two-Axis Matrices
A two-axis matrix classifies objects according to two evaluation criteria, typically divided into high and low values.
Consider the evaluation of research and development projects.
We might use technological novelty and commercialization potential as the two axes, producing four categories:
- High novelty and high commercialization potential
- High novelty and low commercialization potential
- Low novelty and high commercialization potential
- Low novelty and low commercialization potential
This classification is intuitive and convenient. It can help managers discuss investment priorities and compare alternative projects.
However, an important assumption is hidden in this seemingly simple framework.
Why were these two evaluation criteria selected in the first place?
Evaluating R&D projects may involve many factors, including technological maturity, market opportunities, competitive technologies, intellectual property, development costs, organizational capabilities, and strategic synergies.
Selecting only two factors requires justification.
Yet in practice, evaluation axes are sometimes selected based on convention, personal experience, or the popularity of an established management framework.
If the selected criteria are inappropriate, the resulting classification may be misleading, regardless of how carefully the four quadrants are defined.
Does Expanding Four Quadrants into Nine Solve the Problem?
One response to the limitations of a four-quadrant matrix is to divide each axis into three levels: high, medium, and low.
This produces nine categories.
The addition of a middle category can be useful, particularly when extreme classifications would be inappropriate.
However, the fundamental problem remains unchanged.
If the two axes do not adequately represent the important differences among the objects being evaluated, increasing the number of categories does not resolve that limitation.
Similarly, introducing a third axis to create eight categories does not guarantee a better understanding of complex relationships.
Another issue is that real-world characteristics frequently vary continuously.
Artificial classification boundaries may exaggerate differences between objects that are actually very similar.
A project falling just above a threshold may be assigned to a different category from one falling just below it, even though their characteristics are nearly identical.
This does not mean that four-, eight-, or nine-category classifications are inherently inappropriate.
The question is whether the classification criteria and boundaries are meaningful for the intended decision.
The quality of a classification depends primarily on the relevance of its criteria, not on the number of categories it produces.
2. RFM Analysis: Do 125 Segments Really Explain Customer Behavior?
RFM analysis provides another example of the distinction between detailed classification and meaningful understanding.
RFM evaluates customers using three purchasing indicators:
- Recency (R): How recently the customer made a purchase
- Frequency (F): How often the customer purchases
- Monetary Value (M): How much the customer spends
These indicators are useful because they summarize important aspects of purchasing behavior.
A customer who has purchased recently, buys frequently, and spends substantial amounts may be particularly valuable to a business.
One advantage of RFM analysis is its simplicity. It can be performed using transaction records that many businesses already possess.
However, when each indicator is divided into five levels, the result is 125 possible combinations.
Does this mean that the analysis has discovered 125 meaningful types of customers?
Not necessarily.
The Problems of Excessive Segmentation
First, the three RFM indicators are not necessarily independent.
Customers who purchase frequently may also spend more over a given period. Frequency and monetary value may therefore reflect partially overlapping information.
Second, customers are unlikely to be evenly distributed across the 125 possible segments.
Some combinations may contain many customers, while others may contain very few.
Third, the boundaries between segments are defined by the analyst.
Two customers with nearly identical purchasing behavior may be assigned to different segments simply because one falls slightly above a threshold.
Furthermore, RFM analysis does not directly capture many other factors that may be important for understanding customers.
These include product preferences, purchasing motivations, price sensitivity, lifestyle, customer needs, and responses to marketing activities.
Therefore, creating more RFM segments does not necessarily produce a correspondingly richer understanding of customers.
Why RFM Analysis Remains Useful
None of this means that RFM analysis is a poor analytical method.
For identifying inactive customers, prioritizing retention campaigns, or conducting basic customer relationship management, RFM can be practical and effective.
Its simplicity may actually be an advantage.
The important question is what the analysis is intended to accomplish.
If RFM segments demonstrate meaningful differences in future purchasing behavior or responses to marketing campaigns, those classifications have practical value.
Conversely, if 125 segments are generated without establishing how they improve decisions, the additional complexity may accomplish little.
The goal is not to divide customers into as many categories as possible. It is to identify differences that matter and can inform effective action.
3. Classification Versus Structural Discovery
To understand this problem more clearly, we should distinguish between two different approaches to analysis.
The first is classification based on predefined criteria.
Traditional cross charts and conventional RFM segmentation primarily follow this approach.
The analyst selects the variables, defines the categories, and assigns objects to those categories.
The second is discovering relationships and structures within multidimensional data.
This approach can involve multivariate statistical analysis and machine learning.
Several methods are particularly relevant.
Principal Component Analysis (PCA)
PCA identifies directions that explain substantial variation in numerical data.
It can represent data described by many correlated variables using a smaller number of components.
This helps reveal major patterns of variation that may not be obvious when examining variables separately.
Multiple Correspondence Analysis (MCA)
MCA explores associations among multiple categorical variables.
It can represent cases and categories in a lower-dimensional space, helping analysts identify relationships among categorical characteristics.
For example, instead of selecting two evaluation criteria in advance, analysts can examine the relationships among many categorical assessments.
Self-Organizing Maps (SOM)
SOM organizes multidimensional data on a typically two-dimensional grid while attempting to preserve important neighborhood relationships.
Each map node represents a prototype in the original feature space.
By examining the prototypes and clustering the nodes, analysts can identify groups of objects with similar multidimensional characteristics.
Unlike a conventional cross chart, the horizontal and vertical directions of a SOM do not have predefined business meanings.
The value of the map lies in the relationships among its regions and in the characteristics represented by the nodes.
Discovering Structures Rather Than Imposing Them
Suppose 100 R&D projects have been evaluated using ten criteria.
A conventional cross chart begins by selecting two of those criteria.
A multivariate approach can begin with all ten and investigate the relationships among them.
This may reveal unexpected associations, underlying dimensions, or groups of projects that share distinctive characteristics.
Such discoveries may suggest ways of understanding the projects that were not apparent from the original evaluation framework.
However, multivariate analysis does not automatically produce correct business decisions.
PCA identifies directions of variation, not necessarily dimensions of strategic importance.
MCA reveals associations among categories, but those associations are not automatically suitable evaluation criteria.
Similarly, SOM reveals neighborhood structures that still require interpretation and validation.
The value of multivariate analysis is not that it eliminates human judgment, but that it can reveal structures that predefined classification schemes might overlook.
4. Sophisticated Analysis Does Not Require Complicated Explanations
Does this mean that familiar cross charts should be replaced by multivariate analysis?
Not necessarily.
There is an important distinction between the methods used to discover knowledge and the methods used to communicate it.
A sophisticated analysis may involve many variables, statistical models, and complex relationships.
Yet decision-makers may not need to understand every technical detail.
For example, a SOM may reveal distinctive groups of customers and the relationships among them.
However, a business executive may be primarily interested in which customer groups offer growth opportunities, which are at risk, and which require different marketing strategies.
Presenting the entire SOM may not be the most effective way to communicate those findings.
A simpler diagram, a table, or even a conventional two-axis matrix may be more appropriate.
A reasonable analytical workflow would therefore be:
- Identify the decision problem and collect relevant variables.
- Explore the data using appropriate analytical methods.
- Discover and validate important patterns and relationships.
- Select the findings most relevant to the decision.
- Communicate those findings through clear explanations and visualizations.
The final presentation may be a four-quadrant cross chart.
There is nothing inherently wrong with that.
The critical issue is whether the diagram faithfully represents conclusions supported by the analysis.
If the data do not contain four distinct groups, an analyst should not imply that such groups objectively exist merely because a four-quadrant diagram is convenient.
Analysis may need to be multidimensional, while explanation should be as simple as possible without distorting the findings.
5. Can AI Become a Translator of Analytical Results?
Artificial intelligence offers a new possibility: transforming complex analytical results into forms that people can understand and use.
Traditionally, analysts needed to understand statistical methods, interpret their outputs, and construct explanations for decision-makers.
AI can increasingly assist with these tasks.
Imagine a user providing customer data and asking:
“Suggest three useful ways to understand this customer base from a business perspective.”
An AI-assisted analytical system might propose several perspectives:
- Understand customers through their purchasing behavior.
- Identify customers according to their risk of disengagement.
- Evaluate customer groups according to potential marketing responses and business opportunities.
The user could then select the perspective most relevant to the problem.
The system would perform or retrieve the appropriate analysis and present its findings in a comprehensible form.
The result might be a two-axis matrix, a simple network diagram showing relationships among customer groups, or a concise explanation of the most important patterns.
For example, a complex cluster structure might be summarized as:
“Customer Group B exhibits characteristics intermediate between Groups A and C, suggesting a gradual transition in purchasing behavior rather than three completely separate customer types.”
Such an explanation could help decision-makers understand the essential structure without requiring them to operate PCA, SOM, or clustering algorithms themselves.
AI Must Explain Evidence, Not Invent It
There is, however, an important limitation.
AI can generate convincing explanations even when the available evidence does not adequately support them.
A useful analytical system must therefore distinguish between observed facts, statistically supported relationships, interpretations, and hypotheses.
Its explanations should be traceable to the underlying data and analytical results.
Users should also be able to examine alternative interpretations and understand where uncertainty remains.
The ideal role of AI is not simply to make complex analysis sound easy.
It is to transform analytical findings into understandable knowledge while preserving their evidential basis and important limitations.
6. What Makes an Analytical Method Truly Smart?
The sophistication of an analytical method should not be judged primarily by the complexity of its mathematics, the novelty of its algorithms, or the number of categories it produces.
Instead, several more fundamental questions should be considered.
1. Does the Method Address the Right Problem?
The analytical method should match the purpose.
If the objective is to predict customer churn, methods that can be evaluated against actual churn outcomes may be appropriate.
If the objective is to understand diversity in customer behavior, exploratory multivariate analysis may offer greater value.
The method should follow the problem, not the other way around.
2. Does It Preserve Important Information?
Reducing a complex situation to two predefined axes may discard important information.
A smart analysis considers whether relevant multidimensional relationships need to be examined before simplifying the results.
Information reduction is often necessary, but it should be deliberate rather than accidental.
3. Are the Results Valid and Reliable?
Classification boundaries, variable selection, and weighting schemes can all affect analytical conclusions.
If small changes in these assumptions produce dramatically different results, the conclusions should be treated cautiously.
When predictions or decisions are involved, validation against observed outcomes is particularly important.
4. Does the Analysis Lead to Understanding and Action?
An analytically sophisticated model has limited practical value if users cannot understand what its findings mean or how they relate to their decisions.
Conversely, a simple chart can be valuable if it accurately communicates an important insight.
The purpose of analysis is not merely to produce results. It is to improve understanding and decision-making.
5. Is the Method Unnecessarily Complicated?
Advanced machine learning is not always better than straightforward statistical analysis.
If a simple calculation answers the question adequately, a more complex method may add cost and uncertainty without providing meaningful benefits.
A smart method achieves the required analytical quality with an appropriate level of complexity.
7. How ThinkNavi Approaches Analytical Thinking
ThinkNavi aims to support analytical thinking by bringing established qualitative and quantitative methods into a more integrated environment.
Rather than presenting analytical tools as isolated techniques, ThinkNavi emphasizes selecting and combining methods according to the user’s objectives.
Consider the creation of a cross chart.
The conventional approach begins by defining two evaluation axes and assigning cases to the resulting categories.
An alternative is to collect assessments across multiple criteria and examine their structure before deciding how best to represent the cases in two dimensions.
For categorical data, MCA can help reveal associations among the evaluation categories.
For numerical scores, PCA can help identify major dimensions of variation.
The resulting maps can then be interpreted and, where appropriate, presented in a familiar cross-chart format.
These methods do not guarantee that the extracted dimensions are optimal for decision-making. Their interpretation and relevance must still be examined.
Nevertheless, they provide a way to investigate the evidence before committing to a particular two-axis framework.
Such capabilities can be provided without generative AI.
In the future, AI assistance may help users select analytical approaches, interpret their findings, compare alternative perspectives, and create appropriate visual explanations.
The goal is not to promote a particular algorithm as universally superior.
Cross charts, RFM analysis, PCA, MCA, SOM, and other methods all have their strengths and limitations.
What matters is choosing the right method for the question—and knowing what the method can and cannot tell us.
Conclusion: From Increasing Complexity to Deepening Understanding
Expanding four categories into nine, or dividing customers into 125 segments, is not particularly difficult.
But producing more categories does not automatically mean understanding reality more deeply.
Discovering meaningful relationships among numerous variables, identifying the essential patterns, and communicating those patterns through a clear explanation may require considerably more analytical intelligence.
The objective is not to make analysis look sophisticated.
It is to uncover something important that was previously difficult to see.
Sometimes, sophisticated analysis leads to a remarkably simple conclusion.
And sometimes, the smartest analytical decision is not to use a complicated method at all.
Smart analysis is not about using the most complex technique. It is about understanding complex reality appropriately and expressing its essential structure as simply as possible—without sacrificing the accuracy needed for sound judgment.
As AI becomes increasingly capable of performing analytical tasks, the distinction between analyzing information and communicating understanding will become even more important.
The future of analytical software may depend less on how many algorithms it offers and more on how effectively it helps people discover, understand, and act upon meaningful insights.