

Design of Experiments (DOE) is a methodology for systematically planning experiments to investigate factors that influence product performance, quality, manufacturing processes, and other outcomes. Rather than simply changing conditions and comparing the results, DOE determines in advance which factors to examine, how their levels should be combined, how many experiments should be conducted, and how experimental runs should be organized. Its purpose is to obtain reliable knowledge from a limited number of experiments.
Modern experimental design was largely established through the work of British statistician Ronald A. Fisher in the early twentieth century. Through agricultural research, Fisher developed and formalized principles such as randomization, replication, and blocking to make comparisons between experimental treatments more reliable. These methods subsequently spread to manufacturing, chemical engineering, materials development, pharmaceuticals, agriculture, and the social sciences.
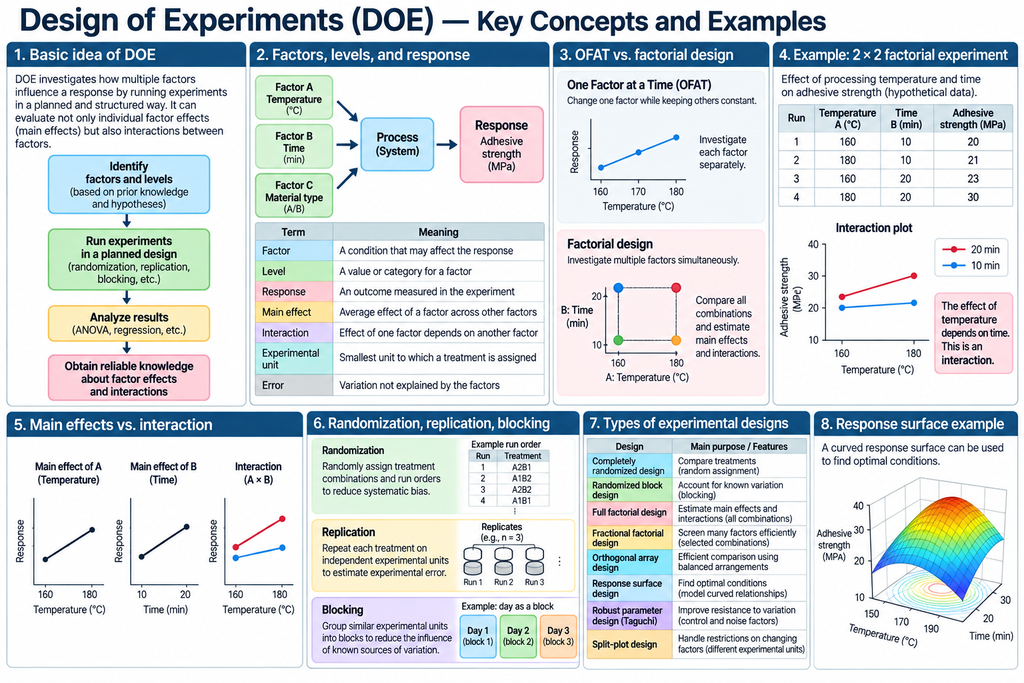
A particularly important feature of DOE is its ability to investigate not only the individual effects of factors but also the interactions that arise when factors are combined. For example, the effect of processing temperature on a material’s properties may depend on processing time. Investigating temperature and time separately may fail to reveal this relationship.
However, DOE does not automatically produce correct conclusions simply because statistical calculations are applied. Appropriate experiments depend on decisions about the research objective, selected factors, measurement methods, experimental ranges, constraints, and interpretation of the results. Statistical knowledge must be combined with an understanding of the subject being investigated.
What Does Design of Experiments Help Us Discover?
The main objectives of DOE can be organized into several categories.
Comparison: Determine whether different materials, products, processing methods, or service procedures produce different outcomes.
Factor Screening: Identify which factors have substantial effects on an outcome among numerous candidates.
Interaction Detection: Determine whether the effect of one factor changes depending on the level of another factor.
Optimization: Identify conditions that produce desirable values of quality, performance, cost, or other measures.
Robustness Improvement: Find conditions under which performance remains stable despite environmental changes, material variation, or other disturbances.
For example, a Cause-and-Effect Diagram may identify materials, equipment, processing conditions, and work procedures as possible contributors to a high defect rate.
However, the diagram alone cannot determine which factors actually affect the defect rate.
DOE allows analysts to modify selected conditions systematically and compare the resulting outcomes, providing a basis for testing causal hypotheses.
In this way, experimental design connects the generation of possible explanations with the empirical investigation of those explanations.
Basic Concepts — Factors, Levels, and Response Variables
Several fundamental concepts are necessary for understanding DOE.
| Term | Meaning | Example |
|---|---|---|
| Factor | A condition that may affect the outcome | Processing temperature, processing time, material type |
| Level | A specific value or category assigned to a factor | 160°C and 180°C |
| Response Variable | An outcome measured during an experiment | Strength, defect rate, processing time |
| Main Effect | The average effect of a factor across the levels of other factors | Average change in strength when temperature changes |
| Interaction | A situation in which the effect of one factor depends on another | Temperature has different effects at different processing times |
| Experimental Unit | The smallest unit independently assigned an experimental condition | A specimen, production batch, or equipment run |
| Experimental Error | Variation not explained by the modeled experimental conditions | Unit-to-unit variation, measurement error, uncontrolled influences |
Factors do not necessarily have to be numerical.
For example, material types, work procedures, and equipment models are categorical factors that can be incorporated into experimental designs.
Similarly, responses may be continuous measurements, such as strength or processing time, or categorical and count outcomes, such as pass/fail results or numbers of defective products.
The appropriate statistical model depends on the nature of the response variable.
Although DOE is generally classified as a quantitative method, qualitative judgments remain essential in formulating hypotheses, selecting factors, and interpreting results.
How DOE Differs from Changing One Factor at a Time
A common experimental approach is to change one condition while keeping other conditions constant. This is known as One Factor at a Time (OFAT).
Suppose a researcher wants to investigate how temperature and processing time affect adhesive strength.
Using OFAT, the researcher might first change temperature while keeping processing time constant, then change processing time while keeping temperature constant.
This approach is straightforward and can be appropriate when examining the local effect of a particular factor under fixed conditions.
However, if the effect of temperature depends on processing time, results obtained at one fixed processing time may not apply at another.
A factorial experiment addresses this limitation by investigating combinations of factor levels.
For example, suppose temperature has two levels, 160°C and 180°C, while processing time has two levels, 10 minutes and 20 minutes.
Combining these levels produces four experimental conditions.
By comparing the results across all four combinations, the researcher can examine the average effects of temperature and time, as well as the interaction between them.
This does not mean that OFAT is always inappropriate. It can be useful for local investigations, preliminary tests, or situations involving severe practical or safety constraints.
The important point is to choose an experimental approach according to the information required.
Practical Example — Effects of Temperature and Processing Time on Adhesive Strength
Consider a simple factorial experiment involving two factors, each at two levels.
A manufacturer wants to investigate how processing temperature (Factor A) and processing time (Factor B) affect adhesive strength.
The temperature levels are 160°C and 180°C, and the processing times are 10 and 20 minutes.
The following values are hypothetical and are provided solely to illustrate the principles of DOE.
| Experimental Condition | Temperature A | Time B | Adhesive Strength (MPa) |
|---|---|---|---|
| 1 | 160°C | 10 min | 20 |
| 2 | 180°C | 10 min | 21 |
| 3 | 160°C | 20 min | 23 |
| 4 | 180°C | 20 min | 30 |
At a processing time of 10 minutes, increasing temperature from 160°C to 180°C increases adhesive strength from 20 MPa to 21 MPa, a difference of 1 MPa.
At a processing time of 20 minutes, the same temperature change increases adhesive strength from 23 MPa to 30 MPa, a difference of 7 MPa.
Thus, the effect of temperature depends on processing time.
This is an example of an interaction between two factors.
If temperature and time had only independent additive effects, the strength increase associated with changing temperature would be the same at both processing times.
In this example, the temperature effect differs by 6 MPa between the two processing times.
This difference-in-differences is evidence of an interaction pattern in the hypothetical data.
However, the table contains only one observation for each experimental condition.
Without independent replication or another appropriate way to estimate experimental error, it is not possible to determine whether the observed interaction is statistically distinguishable from random variation.
A real investigation would therefore need a suitable plan for replication and uncertainty estimation.
Why Interactions Matter
Interactions are among the most important concepts in DOE.
A material’s resistance to high temperatures may depend not only on its composition but also on pressure, humidity, processing time, or its combination with other materials.
In pharmaceutical research, the effect of one ingredient may change in the presence of another.
In business operations, the effectiveness of a work procedure may depend on employee experience or workload.
In these situations, knowing only the average effect of a factor may be insufficient.
Some interactions change the magnitude of an effect, while others reverse its direction.
For example, one processing method may be superior under low-temperature conditions, while another becomes superior at high temperatures.
Cause-and-Effect Diagrams typically organize candidate causes into separate branches. However, actual outcomes may be produced by combinations of factors rather than by factors acting independently.
DOE provides methods for investigating these relationships.
Three Fundamental Principles of Reliable Experimentation
Randomization, replication, and blocking are foundational concepts in experimental design.
Randomization
Randomization involves using an appropriate random process to assign experimental conditions to experimental units or determine the order of experimental runs.
Suppose all low-temperature experiments are conducted in the morning and all high-temperature experiments in the afternoon.
If equipment conditions or environmental temperature change during the day, those changes may become confounded with the temperature treatment.
Randomizing the experimental order can help reduce systematic bias arising from such effects.
However, randomization does not eliminate every source of uncertainty.
Complete randomization may also be impractical when changing equipment settings requires substantial time or cost.
In these circumstances, an experimental design that explicitly accounts for operational restrictions may be more appropriate.
Replication
Replication means applying the same experimental condition to multiple independent experimental units.
Even under nominally identical conditions, experimental outcomes may vary because of differences between specimens, equipment states, environmental conditions, or measurement errors.
Replication provides information about this variability and helps analysts assess the reliability of estimated effects.
However, repeatedly measuring the same specimen is not equivalent to independently repeating the experimental treatment on different specimens.
For example, measuring one treated specimen five times does not necessarily provide the same information as treating five independent specimens under the same conditions.
Treating repeated measurements from a single experimental unit as independent replications can underestimate uncertainty.
This problem is known as pseudoreplication.
Blocking
Blocking is used to account for known sources of variation that are not the primary subject of the experiment.
For example, an experiment conducted over several days may be affected by day-to-day environmental changes.
By arranging relevant treatment comparisons within each day and incorporating the day as a block in the statistical analysis, researchers may be able to distinguish treatment effects from variation between days.
Blocking does not make all experimental conditions identical.
Instead, it incorporates unavoidable sources of variation into the experimental design so that comparisons can be made more precisely.
Major Types of Experimental Designs
DOE includes many different experimental designs. The appropriate choice depends on the number of factors, the cost of experimentation, the importance of interactions, and the research objectives.
| Experimental Design | Main Purpose | Characteristics |
|---|---|---|
| Completely Randomized Design | Compare experimental treatments | Randomly assigns treatments to experimental units |
| Randomized Block Design | Compare treatments while accounting for known variation | Organizes experiments into blocks |
| Full Factorial Design | Investigate main effects and interactions | Tests all selected combinations of factor levels |
| Fractional Factorial Design | Screen multiple factors efficiently | Uses a selected fraction of possible combinations |
| Orthogonal Array Design | Arrange factor levels efficiently | Uses balanced combinations to support selected effect comparisons |
| Response Surface Design | Find desirable operating conditions | Supports modeling of curved relationships |
| Robust Parameter Design | Find conditions resistant to disturbances | Considers control factors and noise factors |
| Split-Plot Design | Handle restrictions on changing experimental conditions | Uses different experimental-unit structures and levels of randomization |
These are not always mutually exclusive alternatives.
For example, a factorial experiment can also incorporate blocking.
Likewise, a response surface design may involve restrictions requiring a split-plot arrangement.
Not every investigation requires an elaborate design. When the number of treatments is small and the problem is straightforward, a relatively simple experimental plan may be sufficient.
Full Factorial Designs and the Growth in Experimental Runs
A Full Factorial Design examines every combination of the selected factor levels.
If all factors have two levels, the number of treatment combinations increases exponentially with the number of factors.
| Number of Factors | Number of Combinations |
|---|---|
| 2 | 4 |
| 3 | 8 |
| 5 | 32 |
| 10 | 1,024 |
For k two-level factors, the number of combinations is 2^k.
These counts represent distinct treatment combinations before adding independent replications.
As the number of factors increases, the number of experiments can become prohibitively large.
Each additional experimental run may require time, materials, equipment capacity, personnel, and financial resources.
Therefore, rather than immediately investigating every possible combination, researchers often begin with screening experiments to identify important factors.
More detailed experiments can then focus on the factors most relevant to the outcome.
Fractional Factorial Designs and Confounding
A Fractional Factorial Design reduces the number of experimental runs by selecting only a subset of the combinations in a full factorial design.
For example, investigating five two-level factors would require 32 treatment combinations in a full factorial design.
Depending on the objective and design structure, a fractional factorial experiment might use 16 or 8 combinations for an initial investigation.
However, reducing the number of experiments comes at a cost.
Some effects may become impossible to distinguish from others.
This is called confounding or aliasing.
For example, in certain designs, the main effect of one factor may be aliased with an interaction between two other factors.
The resulting data cannot independently estimate those effects without additional assumptions or experiments.
Fractional factorial designs therefore often rely on assumptions that certain higher-order interactions are negligible.
When interpreting the results, researchers must understand which effects are independently estimable and which are confounded.
The objective should not simply be to minimize the number of experiments. It should be to obtain the information necessary for the research question with acceptable cost and uncertainty.
Orthogonal Arrays and the Taguchi Method
Genichi Taguchi played an important role in the development and dissemination of experimental design for quality engineering, particularly in Japan.
The Taguchi Method emphasizes techniques such as orthogonal arrays and robust parameter design, which aims to identify operating conditions that remain effective despite environmental disturbances and other sources of variation.
Common orthogonal arrays include L4, L8, L9, L16, and L18.
For example, a full factorial experiment involving four factors at three levels each would require 81 treatment combinations.
An L9 orthogonal array can arrange four three-level factors in nine experimental conditions for selected main-effect comparisons.
However, nine experimental runs do not provide the same information as all 81 combinations.
The effects that can be estimated depend on the choice of array, the assignment of factors to columns, and the treatment of interactions.
The signal-to-noise (SN) ratios used in Taguchi methods are also intended to evaluate performance in relation to variation or deviation from a target.
However, no single SN ratio is universally appropriate for every experiment or engineering objective.
Orthogonal arrays can be valuable tools for improving experimental efficiency, but they should not be applied mechanically without considering interactions, experimental error, and the information required.
Response Surface Methodology — Searching for Optimal Conditions
After identifying important factors, researchers may want to determine the conditions that produce the most desirable outcome.
For example, increasing processing temperature may initially improve product strength, but excessive temperatures may eventually cause material degradation.
Response Surface Methodology (RSM) is used to investigate such relationships and search for favorable operating conditions.
RSM approximates the relationship between factors and response variables using mathematical models.
By incorporating linear terms, interaction terms, and quadratic terms, a model can represent curved relationships rather than assuming that every factor has a constant linear effect.
Common response surface designs include Central Composite Designs (CCD) and Box–Behnken Designs.
Suppose the goal is to maximize adhesive strength while minimizing processing time and energy consumption.
This is a multi-response optimization problem involving several potentially conflicting objectives.
An appropriate model may help identify promising operating conditions.
However, the estimated response surface is an approximation based on observations within the experimental region.
A relationship identified within that region cannot automatically be assumed to remain valid outside it.
Confirmation experiments should be conducted to evaluate the predicted optimum.
DOE, Analysis of Variance, and Regression Analysis
Design of Experiments concerns how experimental conditions and observations should be organized.
Analysis of Variance (ANOVA) and regression analysis are statistical methods used to analyze the data obtained from those experiments.
For example, in a two-factor experiment, response variation may be modeled in terms of the effect of Factor A, the effect of Factor B, the interaction between A and B, and unexplained variation.
Conceptually, the model can be expressed as:
Response = Overall Mean + Effect of A + Effect of B + Interaction of A and B + Error
ANOVA can be used to examine the contributions of these components under an appropriate statistical model.
Regression analysis can also estimate relationships between numerical factor levels and responses.
Experimental design and statistical modeling are therefore closely connected.
However, conventional ANOVA is not suitable for every type of response.
For example, when the outcome is a count of defective products or a binary pass/fail variable, generalized linear models or other methods may be more appropriate.
Statistical significance also does not necessarily imply practical importance.
Effect sizes, confidence intervals, costs, risks, and technical feasibility should be considered when interpreting results.
A Practical DOE Workflow
A typical experimental investigation may follow seven stages.
1. Define the Objective and Hypotheses
Clarify what needs to be compared, which causal hypotheses should be tested, or which performance measures should be improved.
Conducting many experiments without a clearly defined objective does not necessarily produce useful conclusions.
2. Select Factors and Response Variables
Use Cause-and-Effect Diagrams, 5 Whys, direct observations, previous measurements, and technical knowledge to identify candidate factors.
Decide what should be measured and what would constitute an improvement.
Several responses may be necessary, such as product strength, defect rate, and processing time.
3. Establish Factor Levels and Experimental Ranges
Determine the values or conditions to be tested for each factor.
A wider range may make important changes easier to detect, but equipment limitations and safety constraints must be considered.
A range that is too narrow may fail to reveal the importance of a factor.
4. Choose an Experimental Design
Select an appropriate design, such as a comparative experiment, full factorial design, fractional factorial design, or response surface design.
Consider randomization, replication, blocking, the number of experimental runs, and any restrictions on changing factor levels.
5. Conduct the Experiments and Record the Data
Perform the experiments according to the plan and measure the responses.
In practical applications, it is important to record not only intended settings but also actual measured conditions, experimental dates, equipment identifiers, material lots, and unusual events.
6. Analyze the Results
Estimate main effects, interactions, experimental variability, and, where appropriate, nonlinear relationships.
Examine whether the assumptions of the statistical model are reasonable.
This may include checking residual patterns, variation between conditions, and the independence of experimental units.
7. Interpret the Findings and Conduct Confirmation Experiments
Interpret the statistical findings in light of relevant engineering or scientific knowledge.
If necessary, perform further experiments to determine whether the findings hold under different conditions, production lots, or environments.
DOE is not necessarily a one-time activity.
An initial experiment may identify promising factors, a second experiment may investigate their relationships in greater detail, and a subsequent confirmation experiment may test the selected operating conditions.
This sequential approach can often be more efficient than attempting to answer every question in a single experiment.
Limitations and Practical Considerations
Unselected Factors May Remain Undetected
DOE primarily investigates factors included in the experimental design or otherwise appropriately measured and accounted for.
If an important factor is overlooked during the planning stage, its effect may remain unidentified.
This is why preliminary observation, technical investigation, and the systematic identification of possible causes are important.
Results Depend on the Selected Factor Levels
A factor that appears unimportant within one experimental range may have a strong effect elsewhere.
For example, product strength might change very little between 160°C and 180°C but decline sharply near 200°C.
Experimental conclusions must therefore be interpreted within the range of conditions actually investigated.
Reducing Experimental Runs Limits Available Information
Fractional factorial designs and orthogonal arrays can reduce the number of experiments required.
However, they may also introduce aliasing or prevent particular interactions from being estimated separately.
Minimizing the number of experiments without considering the required information can undermine the purpose of the investigation.
Insufficient Replication Limits Error Estimation
Even a well-structured set of factor combinations may provide inadequate information about experimental uncertainty when independent replication is insufficient.
The required replication should be considered in relation to the expected variability, the effect size of interest, and the desired statistical power.
Statistical Models Are Not the Physical Phenomena Themselves
Regression equations and response surfaces can summarize experimental relationships, but they do not necessarily explain the underlying physical mechanisms.
For example, discovering an interaction between temperature and processing time does not establish whether the interaction results from chemical reactions, structural changes in the material, or another process.
Understanding the mechanism may require additional scientific investigation.
Some Problems Cannot Be Investigated Through Direct Experimentation
Safety, ethics, cost, and practical constraints may prevent researchers from freely manipulating experimental conditions.
It may be unacceptable to test conditions that create serious risks or to conduct human-subject experiments without appropriate ethical safeguards.
In such cases, observational studies, existing-data analysis, simulations, or alternative investigative approaches may be more appropriate.
DOE in the AI Era — From Experimental Planning to New Hypothesis Generation
DOE offers numerous opportunities for assistance from large language models and machine learning.
However, simply asking an AI system to “create an experimental design” does not ensure that the resulting plan is appropriate.
An LLM may generate a formally convincing experimental arrangement without fully understanding the research objective, operational constraints, or underlying technical problem.
Effective AI assistance requires distinguishing problem formulation, experimental design, statistical analysis, and interpretation.
Organizing Experimental Objectives and Factors
An LLM can examine research reports, product specifications, incident records, or Cause-and-Effect Diagrams to identify candidate factors and response variables.
For example, when investigating product defects, it may help organize possible factors involving materials, temperature, processing time, and equipment settings.
It may also identify missing information or unclear experimental objectives.
However, the significance of those factors must be evaluated using domain knowledge and evidence from the actual process.
Generating Experimental Designs
Given the number of factors, factor levels, available experimental runs, and operational constraints, an AI-assisted system could recommend candidate experimental designs.
It could compare full factorial, fractional factorial, orthogonal array, and response surface designs while explaining which effects can be estimated and which may be confounded.
For this task, it is generally preferable to use established statistical software to generate and validate design matrices rather than relying on an LLM to produce the numerical arrangements directly.
The LLM can serve as a natural-language interface that helps users select appropriate methods and understand their implications.
Explaining Statistical Results
After an experiment, an LLM can help explain estimated main effects, interactions, regression models, and confidence intervals in natural language.
For example:
“The effect of temperature changes depending on processing time, so the optimal temperature cannot be determined independently of the processing duration.”
However, LLMs can misinterpret statistical significance, uncertainty, and causality.
The system should therefore retain a clear connection between computed statistical results and the explanations generated from them.
Sequential Experimental Design
The results of one experiment can guide the planning of subsequent experiments.
For example, researchers may begin with a screening experiment covering many factors.
After identifying the most influential factors, they may use response surface methods to explore a promising region more thoroughly.
Finally, confirmation experiments can test the selected conditions.
Sequential experimental design has a long history in statistics.
More recently, Bayesian optimization and active learning have introduced approaches that use predictive models, such as Gaussian processes, to select informative or promising experimental conditions.
These methods are related to DOE, but they are not identical to classical factorial experiments and involve different assumptions and modeling requirements.
Discovering New Questions from Experimental Results
Experiments do not merely confirm or reject previously formulated hypotheses.
They may also reveal unexpected phenomena.
For example, a particular combination of material and processing conditions might produce an unusual property that was not anticipated when the experiment was designed.
From the perspective of the original DOE analysis, this might appear as an interaction.
However, investigating the underlying mechanism could lead to an entirely new technological hypothesis or application.
AI may help connect such experimental findings with previous research and analogous phenomena from other fields, supporting the formulation of new scientific questions and development opportunities.
Design of Experiments in ThinkNavi
ThinkNavi positions DOE as an established analytical method for hypothesis testing and systematic problem-solving.
After identifying potential causes using techniques such as Cause-and-Effect Diagrams and 5 Whys, users can apply DOE to investigate whether those factors actually influence the observed results.
A possible implementation in ThinkNavi Free would include factor and level specification, generation of basic factorial designs, randomized experimental run orders, entry of experimental results, and visualization of main effects and interactions.
By extending these capabilities to ANOVA and regression analysis for appropriately replicated experiments, the system could support the process from experimental planning through statistical evaluation.
However, it is important to clearly indicate limitations such as insufficient replication, non-estimable effects, and confounding between factors.
An LLM-powered edition could assist with interpreting experimental objectives expressed in natural language, identifying candidate factors, selecting suitable designs, explaining results, and proposing follow-up experiments.
These are potential future capabilities, not descriptions of functions currently available.
The significance of incorporating DOE into ThinkNavi is not merely to reproduce all the capabilities of a dedicated statistical software package.
The broader objective is to support a continuous process of thinking and investigation: identifying a problem, formulating causal hypotheses, planning experiments to test those hypotheses, analyzing the results, and revising the hypotheses when necessary.
The essential purpose of Design of Experiments is to determine what should be compared, under which conditions, and through which experimental arrangements, so that as much reliable knowledge as possible can be obtained from limited experimentation. Used appropriately, DOE helps transform trial and error into a systematic process of building testable knowledge.
Related Topics
- Cause-and-Effect Diagram (Fishbone Diagram) — Systematically Organizing Factors That May Contribute to a Problem
- Five Whys | Exploring Root Causes by Repeatedly Asking “Why?”
- Abduction | Reasoning Toward Explanations
- Scientific Method | Hypotheses, Tests, and Discovery
- Systems Thinking | Interdependence and Change Over Time
- Multivariate Analysis — Discovering Relationships and Structures Among Multiple Variables
- Regression Analysis
- Analysis of Variance (ANOVA)
- Bayesian Networks
- Decision Matrices
References and Further Reading
- R. A. Fisher, The Design of Experiments, Oliver and Boyd, 1935.
- Douglas C. Montgomery, Design and Analysis of Experiments, Wiley.
- George E. P. Box, J. Stuart Hunter, and William G. Hunter, Statistics for Experimenters: Design, Innovation, and Discovery, Wiley, 2005.
- Genichi Taguchi, Jikken Keikakuhō (Design of Experiments), Maruzen (Japanese).
- NIST/SEMATECH — e-Handbook of Statistical Methods
- NIST — Choosing an Experimental Design
- Pennsylvania State University — STAT 503: Design of Experiments
- Pennsylvania State University — Introduction to Factorial Designs
- Pennsylvania State University — Response Surface Methods and Designs