

A Cause-and-Effect Diagram is an analytical technique used to identify and systematically organize factors that may contribute to a particular outcome. Because its structure resembles the skeleton of a fish, it is commonly called a Fishbone Diagram. It is also known as an Ishikawa Diagram, named after Kaoru Ishikawa, the Japanese quality management expert who developed and popularized the method.
The Cause-and-Effect Diagram is one of the Seven Basic Quality Tools and is closely associated with the development of quality control in Japan. Originally used to investigate product defects and process variation in manufacturing, it is now applied to business process improvement, service quality, IT incident analysis, healthcare safety, and other areas.
The fundamental idea is to avoid immediately assuming that a problem has a single cause. Instead, the analyst examines the problem from multiple perspectives, identifies possible contributing factors, and organizes them into a structured diagram.
However, factors shown in a Cause-and-Effect Diagram are not necessarily verified causes. A Fishbone Diagram is a method for visualizing hypotheses about possible causes, not a method for proving causal relationships. Understanding this distinction is essential for using the technique appropriately.
Basic Structure of a Cause-and-Effect Diagram
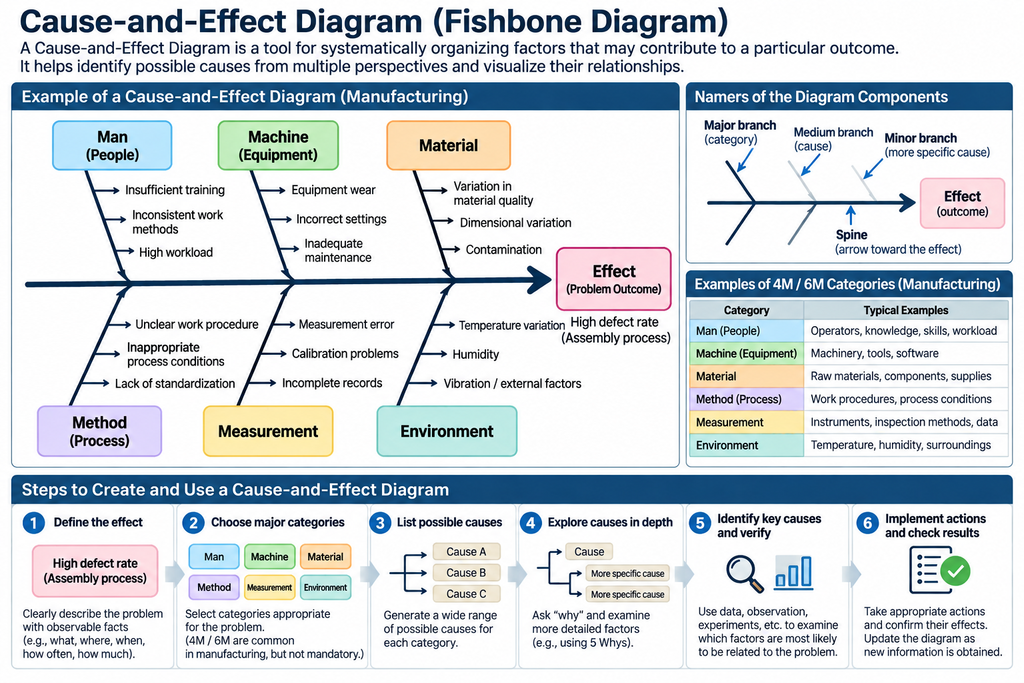
In a Cause-and-Effect Diagram, the outcome being investigated is called the effect, while the conditions or events that may contribute to it are called causes.
The effect is placed on the right side of the diagram. A horizontal arrow extends toward it from the left, forming the central structure or “spine” of the fish.
Major branches connect to this spine and represent broad categories of potential causes. Smaller branches extend from these categories to represent more specific factors.
For example, when investigating a high product defect rate, the major branches might represent materials, equipment, methods, measurement, personnel, and environmental conditions.
This structure serves two purposes. First, it encourages analysts to examine a broad range of possible causes rather than concentrating on the first explanation that comes to mind. Second, it organizes factors hierarchically, making it easier to understand which conditions might be related to the problem.
However, when major branches represent categories, the connecting lines do not necessarily indicate strict causal relationships. For instance, the category “Equipment” does not itself cause product defects. Specific equipment failures, settings, or operating conditions may be contributing factors.
A Cause-and-Effect Diagram should therefore be understood as a combination of a classification structure and a representation of hypothesized causal relationships.
Classifying Causes Using the 4M and 6M Frameworks
In manufacturing, causes are often organized using the 4M or 6M frameworks.
The traditional 4M framework consists of Man, Machine, Material, and Method. The 6M framework adds Measurement and Mother Nature, often referred to as Environment.
| Category | Main Focus | Examples of Possible Causes |
|---|---|---|
| Man (People) | Operators, knowledge, skills, workload | Inadequate training, inconsistent judgment, staffing problems |
| Machine (Equipment) | Machinery, tools, software | Equipment deterioration, incorrect settings, breakdowns |
| Material | Raw materials, components, supplies | Material quality variation, impurities, dimensional differences |
| Method | Work procedures, processing conditions, operating methods | Inadequate procedures, inappropriate processing conditions |
| Measurement | Instruments, inspection methods, data | Measurement errors, calibration problems, missing records |
| Mother Nature / Environment | Temperature, humidity, surroundings, external conditions | Temperature fluctuations, humidity, vibration, environmental disturbances |
These categories can be useful for systematically examining manufacturing processes. However, the 6M framework is not appropriate for every type of problem.
For example, when analyzing customer support delays, categories such as Business Process, Information, Systems, Staffing and Skills, Workload, and Management may be more meaningful.
For software incidents, suitable categories might include Application, Infrastructure, Data, Configuration, Operations, and External Services.
The purpose of classification is to support the discovery of possible causes. Choosing categories appropriate to the problem is more important than following the 4M or 6M framework mechanically.
How to Create a Cause-and-Effect Diagram
1. Define the Effect Clearly
Begin by specifying the outcome or problem to be investigated.
Statements such as “Quality is poor” or “Work is too slow” are too vague. Whenever possible, describe the event, location, time period, frequency, and severity.
For example, instead of writing “The defect rate is high,” the problem could be defined as:
“Fastening defects in the assembly process accounted for 3% of total production during the past month.”
The figures in this example are hypothetical.
It is important not to introduce an assumed cause into the problem statement. Writing “Fastening defects caused by careless operators” assumes a conclusion before the investigation has begun.
The effect should preferably describe an observed outcome.
2. Select the Major Cause Categories
Next, identify the broad categories that will form the main branches of the diagram.
For manufacturing problems, the 4M or 6M framework may be appropriate. For service operations or organizational problems, custom categories may be more useful.
There is no fixed number of categories.
Too many categories can make the diagram unnecessarily complicated, while too few may combine unrelated types of factors.
The initial classification does not need to be perfect. Categories can be revised as additional potential causes are identified.
3. Identify a Broad Range of Possible Causes
Consider factors within each category that may contribute to the effect.
Brainstorming can be used to gather ideas from different participants.
For example, equipment-related factors might include mechanical wear, unstable settings, inadequate maintenance, or insufficient abnormality detection.
At this stage, it is usually better not to limit the investigation to a few apparently important causes. The purpose is to identify possibilities that might otherwise be overlooked.
However, suggested explanations should not be treated as established facts. It is useful to distinguish information supported by observation from hypotheses based on judgment or experience.
4. Investigate Causes in Greater Depth
For each identified factor, ask what might explain it.
For example, if equipment settings were inappropriate, investigate why the incorrect settings were used.
Possible explanations might include inadequate procedures, missing information, unclear responsibilities, or the absence of a verification mechanism.
This approach resembles the 5 Whys technique.
However, there is no requirement to follow only one causal chain. Multiple candidate causes can be investigated in parallel, and each can be examined to the depth appropriate to the problem.
5. Identify Important Candidates for Investigation
After generating a broad range of potential causes, consider which factors are most likely to be related to the observed problem.
Use available evidence, including production records, equipment logs, inspection results, and direct observation.
For example, if defects are concentrated on one particular machine, equipment conditions may deserve priority.
If defects occur across several machines but are concentrated in a specific material lot, material-related factors may be more relevant.
Expert judgment or voting may help determine investigation priorities, but the most frequently mentioned explanation is not necessarily the correct one.
6. Verify the Causes
Investigate the most important candidates using appropriate evidence and analytical methods.
Depending on the problem, verification may involve comparing measurement data, examining operating conditions, conducting experiments, observing processes, or applying statistical analysis.
For example, if temperature is suspected of affecting the defect rate, measurements can be used to examine the relationship.
However, identifying a correlation does not, by itself, establish causation. Other factors may need to be considered, and experiments may be necessary.
7. Implement Corrective Actions and Evaluate Their Effects
Once important causes have been sufficiently verified, implement corrective actions.
After implementation, determine whether the relevant performance indicators have improved.
These might include defect rates, processing times, failure frequencies, or customer complaints.
If the expected improvement does not occur, reconsider the causal hypotheses and corrective actions.
Rather than treating the diagram as a one-time document, it can be updated as new information becomes available.
Practical Example — Investigating Delayed Customer Responses
Consider a company experiencing delays in responding to customer inquiries.
The effect is defined as:
“Initial responses to customer inquiries exceed the company’s 24-hour response-time target.”
This is a hypothetical example.
Instead of applying the manufacturing-oriented 6M framework, we can establish categories more relevant to customer support operations.
| Major Category | Possible Cause | Example of a More Specific Factor |
|---|---|---|
| Business Process | Delayed ticket assignment | No defined procedure for handling automatic routing failures |
| Information | Missing information required for processing | Product name is optional on the inquiry form |
| Systems | Notifications are not delivered | Incorrect notification settings or inadequate error monitoring |
| Staffing and Skills | Too few qualified employees | Knowledge of certain products is concentrated among a few specialists |
| Workload | Excessive inquiry volume | Seasonal increases exceed processing capacity |
| Management | Delays are discovered too late | No indicators or monitoring procedures for unresolved tickets |
These are hypothetical causal candidates, not verified explanations.
For example, checking the inquiry form can establish whether the product name is optional. However, determining whether this configuration actually contributes to delayed responses requires further investigation.
Comparing response times for inquiries with and without product names may provide useful evidence.
There may also be multiple contributing factors. Even when automatic routing works correctly, high inquiry volumes or insufficient staffing may still produce delays.
A Cause-and-Effect Diagram helps organize these possibilities in relation to a common problem.
Strengths of Cause-and-Effect Diagrams
The first advantage is the ability to examine a broad range of potential causes. Instead of concentrating on a single explanation, analysts can use different categories to guide their investigation.
Second, the method facilitates the integration of knowledge from different participants. Equipment engineers, production operators, quality managers, and other stakeholders can contribute their perspectives.
Third, it provides a hierarchical structure for organizing factors. Analysts can move from broad categories toward specific conditions that can be investigated.
Fourth, the technique is accessible. It does not require advanced mathematics or specialized software.
A diagram can be developed using a whiteboard, paper, or a digital workspace, making it suitable for collaborative analysis.
Limitations of Cause-and-Effect Diagrams
Factors Shown in the Diagram Are Not Necessarily Real Causes
A Fishbone Diagram may contain many factors suggested through experience or speculation.
The completed diagram does not reveal which factors actually contribute to the outcome.
Because a well-organized diagram can appear convincing, users may mistakenly believe that the problem has already been explained.
Organizing possible causes and demonstrating their actual effects are separate activities.
Categories Can Restrict Thinking
Frameworks such as 4M and 6M provide useful starting points, but predetermined categories may cause analysts to overlook factors that do not fit them.
For example, manufacturing problems may involve product design, supplier contracts, organizational responsibilities, or communication between departments.
It may therefore be necessary to modify categories or retain candidate causes that have not yet been classified.
Interactions Between Factors Are Difficult to Represent
A Cause-and-Effect Diagram is well suited to organizing multiple factors that may contribute to a particular outcome.
However, real-world factors can interact with one another.
For example, increased employee workload may lead to more mistakes. These mistakes may generate rework, which further increases workload.
This creates a feedback loop.
Such circular relationships are difficult to represent accurately in a conventional Fishbone Diagram.
Similarly, some failures occur only when multiple conditions are present simultaneously.
Methods such as Fault Tree Analysis, Causal Loop Diagrams, or Bayesian Networks may be more appropriate for representing these relationships.
The Diagram Does Not Quantify the Importance of Causes
A Cause-and-Effect Diagram can display numerous factors, but it does not automatically determine how strongly each factor influences the outcome.
The position, length, or visual prominence of a branch does not establish the magnitude of its causal contribution.
Evaluating importance requires additional evidence, such as frequency data, measurements, or experimental results.
Results Depend on Human Judgment
The factors selected, the categories used, and the priorities assigned to them depend on the knowledge and assumptions of the participants.
Experienced operators and managers may interpret the same problem differently.
These differences are not necessarily undesirable. They may reveal important alternative perspectives.
However, agreement among participants does not prove that an explanation is correct.
It may be more useful to preserve competing explanations as hypotheses requiring investigation.
Combining Fishbone Diagrams with 5 Whys
Cause-and-Effect Diagrams and 5 Whys are both used for causal investigation, but their emphasis differs.
5 Whys repeatedly asks why a particular event occurred, encouraging deeper exploration of a causal explanation.
A Cause-and-Effect Diagram examines a broader range of factors that may contribute to the same outcome.
This distinction can be understood in terms of the breadth and depth of causal exploration.
A Fishbone Diagram helps identify numerous possibilities, while 5 Whys can be used to investigate selected factors in greater detail.
For example, a team might first construct a Cause-and-Effect Diagram to organize possible explanations and then apply 5 Whys to the most promising candidates.
However, answers obtained through 5 Whys remain hypotheses until they are supported by evidence.
Combining the two methods does not automatically establish the correct causes.
Relationships with Other Quality and Causal Analysis Methods
Cause-and-Effect Diagrams can be used alongside other analytical techniques.
| Method | Main Purpose | Relationship to Fishbone Diagrams |
|---|---|---|
| 5 Whys | Investigate individual causal explanations in greater depth | Develop selected factors |
| Pareto Chart | Identify categories associated with the highest frequencies or losses | Prioritize areas for investigation |
| Check Sheet | Record and summarize observations | Collect evidence relevant to causal hypotheses |
| Scatter Diagram | Visualize relationships between two variables | Examine associations between factors and outcomes |
| Design of Experiments (DOE) | Test the effects of controlled factors | Experimentally evaluate causal hypotheses |
| Fault Tree Analysis (FTA) | Analyze logical combinations of failure conditions | Examine how multiple factors produce failures |
| Failure Mode and Effects Analysis (FMEA) | Identify failure modes, effects, and risks | Support prevention and prioritization |
| Systems Thinking | Examine interactions and feedback structures | Analyze relationships that conventional Fishbone Diagrams cannot represent effectively |
Not every investigation requires all these techniques.
The appropriate combination depends on the nature of the problem, the availability of data, and the level of confidence required.
Fishbone Diagrams and the KJ Method
Cause-and-Effect Diagrams and the KJ Method both organize collections of information, but they differ in purpose and structure.
A Cause-and-Effect Diagram begins with a specific outcome and organizes factors believed to contribute to it.
Its main purpose is to structure hypotheses about possible causes.
The KJ Method, by contrast, begins with observations, records, or other pieces of information. It seeks to discover meaningful groupings and relationships from those materials, potentially leading to a new interpretation of the situation.
In the KJ Method, the central problem itself may become clearer through the process of organizing information.
Therefore, a Cause-and-Effect Diagram may be appropriate when the outcome to be investigated is already clear.
When the nature of the problem is still uncertain, a method such as the KJ Method may be more appropriate for the initial exploration.
Fishbone Diagrams in the AI Era — From Organizing Causes to Verifying Them
Cause-and-Effect Diagrams are well suited to assistance from large language models.
Given a natural-language description of a problem, an LLM can suggest possible contributing factors, group them into categories, and arrange them hierarchically.
AI could therefore assist with the preliminary identification and organization of potential causes.
However, LLM-generated causes may be based on general knowledge or superficially similar cases rather than direct evidence from the actual situation.
For example, when asked to investigate manufacturing defects, an LLM might suggest inadequate operator training, insufficient equipment maintenance, or material variation.
These are plausible possibilities, but there is no reason to assume they are present in the factory under investigation.
Making AI-assisted analysis useful therefore requires more than automatically generating a Fishbone Diagram.
The important task is to connect causal hypotheses with observations and supporting evidence.
Generating Causes from Multiple Perspectives
AI can propose possible causes based on the problem description and available contextual information.
It may use the conventional 4M or 6M categories or suggest classifications better suited to the particular problem.
It can also examine the initial diagram from alternative perspectives to identify factors that may have been overlooked.
Distinguishing Observed Facts from Hypotheses
Each candidate cause should be linked to the information supporting it.
For example, measurement records may confirm that equipment temperature was unusually high.
However, the claim that the higher temperature caused an increase in defects may still be a hypothesis.
A useful analytical system should distinguish these two statements.
This prevents AI-generated explanations from being mistaken for verified causes.
Managing the Verification Status of Each Cause
Each candidate factor could be assigned a verification status, such as:
- Unverified: A possible cause that has not yet been investigated.
- Under Investigation: Relevant observations or measurements are being collected.
- Supported by Evidence: Available information supports the hypothesis.
- Contradicted by Evidence: Available information conflicts with the hypothesis.
- Verified: The hypothesis has met a defined verification criterion.
Displaying these states in the diagram could transform it from a static collection of possible causes into a tool for monitoring analytical progress.
However, even a “Verified” status should indicate what was established, under which conditions, and according to which criteria.
Connecting with Other Analytical Methods
Factors organized in a Fishbone Diagram can be transferred to other analytical techniques.
For example, a user might select one factor for deeper investigation using 5 Whys.
If measurement data are available, the relationship between a candidate factor and the outcome could be explored using a Scatter Diagram or statistical analysis.
Interactions among several factors could be investigated using Design of Experiments.
Fault Tree Analysis could be used when combinations of conditions need to be represented explicitly.
These connections would allow the Cause-and-Effect Diagram to function as an entry point to a broader causal investigation rather than merely as a standalone diagramming tool.
Cause-and-Effect Diagrams in ThinkNavi
ThinkNavi presents Cause-and-Effect Diagrams as a foundational method for investigating potential causes of problems, with opportunities to integrate them with related techniques such as 5 Whys.
A possible implementation in ThinkNavi Free would provide a manual workspace for entering the effect, adding potential causes, editing the hierarchical structure, changing categories, marking important factors, and recording supporting evidence.
If users can also save the investigation status and findings associated with each factor, the diagram could remain useful throughout the verification process.
An LLM-powered edition could extend these capabilities by extracting candidate causes from problem descriptions, suggesting additional perspectives, assisting with classification, developing explanations through 5 Whys, proposing verification methods, and identifying missing or contradictory evidence.
These are possible future capabilities, not descriptions of features currently available.
There is also no need to treat the conventional fishbone structure as the only representation of the analytical data.
When factors interact, the same information could potentially be transformed into a causal network, a Bayesian Network, or another structure more appropriate to the relationships being investigated.
The essential value of a Cause-and-Effect Diagram is not the completion of a fish-shaped drawing. It is the systematic exploration of possible causes and the identification of what must be investigated to improve our understanding of a problem.
Related Topics
- Five Whys | Exploring Root Causes by Repeatedly Asking “Why?”
- Brainstorming — Generating More Ideas by Suspending Judgment
- The KJ Method | Building Meaningful Structures from Fragmented Information
- Find and Frame Problems
- Abduction | Reasoning Toward Explanations
- Critical Thinking | Examining Claims and Evidence
- Systems Thinking | Interdependence and Change Over Time
- Bayesian Networks | Reason with Conditional Probabilities
- Design of Experiments (DOE) — Investigating Multiple Factors and Their Interactions Through Systematic Experimentation
- FMEA and FTA
References and Further Reading
- Kaoru Ishikawa, Guide to Quality Control, Asian Productivity Organization, 1976.
- Kaoru Ishikawa, Introduction to Quality Control, 3A Corporation, English edition.
- Nancy R. Tague, The Quality Toolbox, 2nd ed., ASQ Quality Press, 2005.
- Union of Japanese Scientists and Engineers (JUSE) — QC Story and Quality Control Methods (Japanese)
- Institute of JUSE — Fishbone Diagram (Japanese)
- American Society for Quality — Fishbone Diagram
- Institute for Healthcare Improvement — Cause and Effect Diagram