

Multivariate analysis refers to a collection of statistical methods that examine multiple variables simultaneously to identify relationships, make predictions, classify observations, reduce dimensionality, and discover underlying structures in data. It is used in a wide range of applications, including investigating factors that affect product quality, predicting customer purchasing behavior, understanding product characteristics from numerous measurements, and exploring attitudes or values underlying survey responses.
Traditional statistics textbooks often introduce multivariate analysis through mathematical concepts such as probability distributions, matrices, and eigenvalues. However, people who want to apply these methods usually have more practical questions: What can the method reveal? What kind of data is required? What results will the software produce?
Modern statistical software can perform most of the complex calculations automatically. For users, the essential skills are selecting a method appropriate to their objectives, understanding its results, and recognizing the limitations of the conclusions that can be drawn.
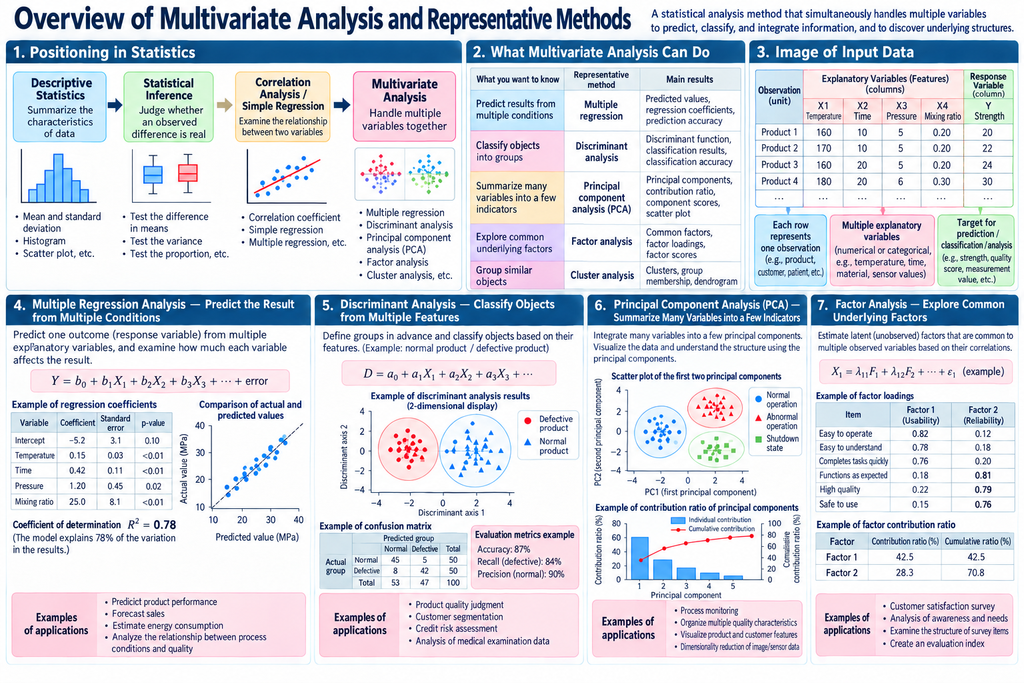
This page introduces the overall landscape of multivariate analysis, focusing on four representative methods: multiple regression analysis, discriminant analysis, principal component analysis, and factor analysis.
Understanding Multivariate Analysis in the Context of Statistics
For beginners, statistics can be introduced through a progression of analytical questions.
Descriptive Statistics — What Does the Data Look Like?
Suppose we measure the strength of 100 manufactured products.
We can calculate the mean, standard deviation, maximum, and minimum values. A histogram can show how the measurements are distributed.
Descriptive statistics provides fundamental methods for summarizing and understanding the characteristics of collected data.
Statistical Hypothesis Testing — How Should We Interpret Observed Differences?
Suppose two manufacturing methods produce different average product strengths.
Because measurements naturally vary, we must consider whether the observed difference could have arisen from random variation.
Statistical hypothesis testing provides procedures for evaluating observed differences under specified statistical assumptions. However, a statistical test alone does not establish causality or practical importance.
Correlation and Regression — How Are Variables Related?
For example, does product strength tend to increase as processing temperature increases?
A scatterplot can help visualize the relationship between two variables. A correlation coefficient summarizes the direction and strength of a linear relationship.
Regression analysis represents relationships between variables using mathematical models and can be used to estimate one variable from another.
Multivariate Analysis — What Happens When We Consider Multiple Variables Together?
Real-world problems rarely involve only one explanatory factor.
Product strength may depend on processing temperature, processing time, pressure, material composition, and equipment conditions.
Furthermore, the objective is not always to predict a numerical value. We may want to classify products as acceptable or defective, summarize dozens of measurements into a few meaningful indicators, or discover common patterns underlying survey responses.
Multivariate analysis provides statistical methods for addressing these kinds of problems involving multiple variables.
This progression is intended as a learning guide rather than a strict hierarchy of statistical methods. Multivariate analysis overlaps with descriptive statistics, hypothesis testing, and regression.
In technical statistical terminology, a distinction is sometimes made between multivariable analysis, involving multiple explanatory variables, and multivariate analysis, involving multiple response variables. However, in Japanese statistical practice, the term corresponding to “multivariate analysis” is commonly used in a broader sense that includes multiple regression and other methods involving several variables. This page follows that broad, practical usage.
What Can Multivariate Analysis Do?
Although there are many multivariate methods, beginners can understand them more easily by focusing on their purposes.
| What Do You Want to Know? | Representative Method | Typical Results |
|---|---|---|
| Predict an outcome from several conditions | Multiple Regression Analysis | Prediction equation, regression coefficients, predicted values |
| Determine which predefined group an observation belongs to | Discriminant Analysis | Discriminant function, classifications, accuracy measures |
| Summarize numerous measurements using a few indicators | Principal Component Analysis (PCA) | Principal components, explained variance, scores, scatterplots |
| Explore common underlying factors behind observed variables | Factor Analysis | Common factors, factor loadings, factor scores |
| Group observations according to similarity | Cluster Analysis | Clusters, group memberships, dendrograms |
The following sections explain the first four methods in greater detail.
1. Multiple Regression Analysis — Predicting Outcomes from Several Variables
Multiple regression analysis examines how one outcome variable is related to several explanatory variables.
For example, suppose a product’s strength is influenced by processing temperature, processing time, and material composition.
By collecting data on these conditions and the resulting product strength, multiple regression can estimate a mathematical relationship between them.
A basic multiple linear regression model has the following form:
Y = b₀ + b₁X₁ + b₂X₂ + b₃X₃ + … + Error
Here, Y represents the outcome to be explained or predicted, while X₁, X₂, and X₃ are explanatory variables. The constant b₀ is the intercept, and b₁, b₂, and b₃ are regression coefficients.
For example:
- Y: Product strength
- X₁: Processing temperature
- X₂: Processing time
- X₃: Material composition ratio
The model estimates the outcome using a combination of these variables.
Each regression coefficient describes how the predicted value of Y changes as the corresponding explanatory variable changes, while the other explanatory variables in the model are held constant.
What Results Does Statistical Software Produce?
Multiple regression software typically provides:
- Regression equation: A mathematical model for predicting the outcome.
- Regression coefficients: Estimates of the direction and magnitude of relationships between explanatory variables and the outcome.
- Coefficient of determination (R²): A measure of how much of the observed variation in the outcome is explained by the fitted model.
- Statistical tests and confidence intervals: Information about uncertainty in estimated coefficients.
- Predicted values and residuals: Predicted outcomes and their differences from observed values.
For example, an R² of 0.78 means that the fitted model explains 78% of the variation in the outcome within the analyzed dataset.
This is a hypothetical example. It does not mean that the model predicts new observations with 78% accuracy.
In practical applications, it is important to examine not only the coefficient table but also plots comparing predicted and observed values and the distribution of residuals.
What Is Multiple Regression Used For?
Multiple regression is used for applications such as product performance prediction, sales forecasting, energy consumption estimation, and analysis of relationships between manufacturing conditions and product quality.
However, identifying a statistical relationship does not establish that one variable causes another.
Causal investigation may require controlled experiments, additional measurements, or other methods that account for alternative explanations.
Another important issue is multicollinearity, which occurs when explanatory variables are strongly related to one another. Multicollinearity can make individual regression coefficients unstable and difficult to interpret.
2. Discriminant Analysis — Classifying Observations Based on Multiple Characteristics
Discriminant analysis is a statistical method for assigning observations to predefined groups using their measured characteristics.
For example, a manufacturer may want to determine whether a product is acceptable or defective based on its dimensions, weight, surface characteristics, and sensor measurements.
While multiple regression typically predicts a numerical outcome, discriminant analysis predicts group membership.
Practical Example — Classifying Acceptable and Defective Products
Suppose historical manufacturing records contain measurements for products already identified as acceptable or defective.
These records can be used to develop a discriminant function that helps distinguish the two groups.
In a basic linear discriminant analysis model, a discriminant score can be written as:
D = a₀ + a₁X₁ + a₂X₂ + a₃X₃ + …
Here, D is the discriminant score, X₁, X₂, and X₃ represent measured characteristics, and the coefficients are estimated to distinguish the groups.
In a basic two-group linear discriminant analysis, the score is combined with a classification rule to assign new observations to one of the groups.
The specific rule may depend on the distributions of the groups and their prior probabilities.
What Results Does Statistical Software Produce?
Discriminant analysis software typically provides:
- Discriminant function: A mathematical expression used to distinguish groups.
- Discriminant scores: Values calculated for individual observations.
- Classification results: Predicted group memberships.
- Confusion matrix: A table comparing actual and predicted classifications.
- Classification performance measures: Accuracy and measures of performance for individual groups.
For example, a classification model might achieve an overall accuracy of 90%.
However, even with high overall accuracy, the model may be unsuitable for quality control if it fails to detect many defective products.
It is therefore important to examine how often defective products are correctly detected and how often acceptable products are incorrectly classified as defective.
Evaluating a model only on the data used to develop it may also produce an overly optimistic assessment.
Performance should be tested using data that were not used to fit the model.
What Is Discriminant Analysis Used For?
Discriminant analysis is used in product quality classification, customer segmentation, credit risk assessment, and the analysis of medical test data.
However, linear discriminant analysis involves assumptions concerning the distributions and covariance structures of variables within groups.
Depending on the data and application, logistic regression, decision trees, or other classification models may be more appropriate.
3. Principal Component Analysis — Summarizing Many Variables with a Few Indicators
Principal Component Analysis (PCA) is a method for summarizing information contained in numerous variables using a smaller number of new variables.
Suppose a manufacturing machine has 20 sensors measuring temperature, pressure, flow rate, vibration, electrical current, and other operating conditions.
Examining all 20 measurements individually may make it difficult to understand the overall state of the machine.
Some sensors may also show similar patterns of variation, indicating that their measurements contain overlapping information.
PCA constructs new indicators by combining the original variables.
The first principal component can be represented as:
PC₁ = a₁X₁ + a₂X₂ + a₃X₃ + …
Here, PC₁ is the first principal component, and X₁, X₂, and X₃ represent the original variables.
The coefficients are selected so that the first principal component captures as much of the variation in the data as possible.
The second principal component then captures as much of the remaining variation as possible while being uncorrelated with the first component. Further components can be calculated as needed.
If most of the variation in 20 variables can be represented by two or three principal components, the dataset may become easier to visualize and analyze.
However, the extent to which information can be summarized depends on the data.
PCA primarily preserves variation in the original measurements, which is not necessarily the same as preserving the information most important for a particular analytical objective.
What Results Does Statistical Software Produce?
PCA software typically provides:
- Principal components: New variables constructed from the original measurements.
- Component coefficients and loadings: Values showing how the original variables contribute or relate to the components.
- Explained variance ratios: The proportion of total variance represented by each principal component.
- Cumulative explained variance: The proportion represented by several components together.
- Principal component scores: Values of the components for each observation.
- Score plots: Scatterplots showing observations on principal component axes.
For example, suppose the first two principal components explain 65% of the variation in a dataset containing 20 measurement variables.
This is a hypothetical example.
In this case, each product or measurement period can be represented as a point on a two-dimensional scatterplot.
If normal operating observations tend to occupy one region while abnormal observations appear elsewhere, the visualization may help identify changes in operating conditions.
However, PCA does not use predefined normal and abnormal labels to maximize their separation. It does not guarantee classification accuracy.
What Is PCA Used For?
PCA is used in manufacturing process monitoring, the analysis of multiple quality characteristics, visualization of product or customer differences, and dimensionality reduction for images and sensor measurements.
It can be particularly useful when many variables are correlated and contain overlapping information.
However, the results may depend strongly on data preprocessing.
For example, when variables have different measurement units or substantially different variances, the decision to standardize them can change the components obtained.
Variable selection and preprocessing are therefore important parts of the analysis.
4. Factor Analysis — Exploring Common Factors Behind Observed Variables
Factor analysis is used to investigate underlying factors that may account for correlations among multiple observed variables.
These underlying factors are not necessarily measured directly.
For example, consider a customer satisfaction survey containing the following statements:
- The product is easy to operate.
- I can quickly find the functions I need.
- I can complete tasks efficiently.
- The product operates reliably.
- I trust the quality of the product.
- I feel confident using the product.
Responses to these questions may exhibit common patterns.
The first three statements might be associated with an underlying factor interpreted as Usability, while the remaining statements might be associated with a factor interpreted as Reliability.
Factor analysis estimates such structures from the correlations among observed variables.
The Factor Analysis Model
Factor analysis assumes that an observed variable can be represented using common factors and a variable-specific component.
For example:
X₁ = λ₁₁F₁ + λ₁₂F₂ + ε₁
Here:
- F₁ and F₂ represent common factors.
- λ₁₁ and λ₁₂ are factor loadings.
- ε₁ represents the portion not explained by the common factors.
This is a simplified representation. Formal factor analysis models also involve assumptions concerning means, variances, and the relationships among factors and errors.
The equation resembles a regression model, but the objective is different.
Multiple regression uses explanatory variables to predict a specific outcome.
Factor analysis attempts to explain the relationships among observed variables through a smaller number of underlying factors.
What Results Does Statistical Software Produce?
Factor analysis software typically provides:
- Common factors: Estimated underlying dimensions shared by observed variables.
- Factor loadings: Values describing the relationships between observed variables and factors.
- Factor retention information: Statistical criteria and diagnostic results used when deciding how many factors to retain.
- Communalities: Estimates of the proportion of each observed variable’s variance explained by the common factors.
- Factor scores: Estimated factor values for individual observations.
- Loading tables and plots: Visual representations of how variables relate to factors.
For example, an analysis of six survey items might produce two factors that can reasonably be interpreted as Usability and Reliability.
However, statistical software does not objectively discover that these factors are named “Usability” or “Reliability.”
The analyst interprets the factors by examining their loadings and the meaning of the survey questions.
Furthermore, discovering a factor structure that explains observed correlations does not prove that the factors exist as separate psychological entities.
What Is Factor Analysis Used For?
Factor analysis is widely used in psychology, social research, marketing, customer satisfaction surveys, and organizational studies.
It is useful when researchers want to identify a smaller set of evaluation dimensions from numerous questionnaire items or examine the structure of a concept they are attempting to measure.
However, evaluating the validity of a factor structure requires attention to question wording, sampling, sample size, measurement reliability, and other aspects of the research design.
What Is the Difference Between PCA and Factor Analysis?
PCA and factor analysis are frequently confused because both can produce a small number of dimensions from a larger set of observed variables.
Their outputs may also appear similar.
However, their objectives and underlying models differ.
| Comparison | Principal Component Analysis | Factor Analysis |
|---|---|---|
| Main objective | Summarize information using fewer variables | Estimate latent factors underlying correlations |
| Basic approach | Construct new axes as linear combinations of observed variables | Model observed relationships using common factors |
| Typical outputs | Components, explained variance, component scores | Factor loadings, communalities, factor scores |
| Common applications | Dimensionality reduction, visualization | Psychological scales, attitude surveys, latent structure exploration |
For example, PCA may be appropriate when the goal is to summarize 20 sensor measurements into two indicators that describe equipment operation.
Factor analysis may be appropriate when the goal is to investigate what common psychological constructs underlie 20 questionnaire items.
The choice depends on the analytical objective and the characteristics of the data.
Other Representative Multivariate Methods
Multivariate analysis includes many methods beyond the four introduced above.
Cluster Analysis groups observations according to similarity without requiring predefined group labels. This differs from discriminant analysis, which uses known groups to develop a classification rule.
Multidimensional Scaling (MDS) uses similarities or distances between observations to represent them in a low-dimensional space, often two or three dimensions. It can be used to visualize consumer perceptions of brands or differences among products.
Correspondence Analysis visualizes relationships between categorical variables. For example, it can help explore patterns in a contingency table relating customer characteristics to product categories.
Partial Least Squares (PLS) Regression can be useful when explanatory variables are numerous and strongly correlated. It constructs components that help model the relationship between explanatory variables and the response.
Multivariate Analysis of Variance (MANOVA) examines group differences while considering multiple response variables simultaneously.
Users do not need to memorize every method.
The first priority is to identify the question they want to answer and then select a method that fits the purpose.
What Matters When Using Statistical Software?
It is possible to apply multivariate analysis without understanding every mathematical derivation.
However, simply selecting a method and clicking an analysis button does not guarantee a valid result.
First, examine the analytical objective and the structure of the data. Clarify what should be predicted, classified, summarized, or discovered. Understand what each row and column represents, whether measurement units are appropriate, and how missing observations should be handled.
Second, consider variable selection and preprocessing. Including many irrelevant variables can make models more complex and sometimes less reliable. Standardization, missing-data treatment, and examination of unusual observations may be important.
Third, examine model assumptions and limitations. Regression models involve assumptions concerning residuals and relationships among variables. Discriminant analysis involves assumptions that depend on the selected model. PCA and factor analysis require careful consideration of correlations, preprocessing, and interpretation.
Fourth, evaluate reproducibility and predictive performance. A model may fit the data used to develop it very well while performing poorly on new observations. Prediction and classification models should be evaluated using suitable data that were not used to fit them.
Fifth, distinguish statistical relationships from causal relationships. Statistically significant associations or clearly defined groups do not automatically establish causal explanations. Controlled experiments, additional investigations, or domain-specific knowledge may be needed.
The Relationship Between Multivariate Analysis and Machine Learning
Multivariate analysis and machine learning are not entirely separate fields.
Multiple regression and discriminant analysis are traditional statistical techniques that can also be used as predictive and classification models in machine learning.
PCA and cluster analysis are often included among unsupervised learning methods.
Machine learning also includes many other approaches, such as decision trees, random forests, gradient boosting, and neural networks.
Traditional statistical analysis often emphasizes parameter estimation, hypothesis testing, uncertainty, and model interpretation.
Machine learning often places particular emphasis on predictive performance for previously unseen data.
However, this distinction is only a general tendency.
Prediction has always been important in statistics, while interpretability, uncertainty, and causality are also active topics in machine learning research.
The important question is not which label a method belongs to, but what the analysis is intended to accomplish.
Connecting Qualitative Analysis with Multivariate Analysis
Although multivariate analysis operates primarily on numerical data, qualitative thinking plays an important role in defining analytical questions and interpreting the results.
Consider a customer satisfaction study.
Researchers may begin by interviewing customers to investigate the problems they encounter and the characteristics they value.
The interview findings can then be organized using a method such as the KJ Method to identify important themes.
These themes may be used to develop questionnaire items.
After conducting the survey, factor analysis can be applied to examine common dimensions underlying the responses.
The resulting factors can then be investigated in relation to customer satisfaction or continued-use intentions using methods such as multiple regression.
A possible workflow is:
Customer Interviews → KJ Method → Hypotheses and Questionnaire Development → Survey → Factor Analysis → Multiple Regression → Interpretation and New Hypotheses
In such an investigation, qualitative and quantitative analysis do not need to be treated as unrelated activities.
However, statistical analysis does not guarantee that questionnaire items correctly represent the concepts they were intended to measure.
The definitions of those concepts and the validity of the measurements still require careful examination.
Multivariate Analysis in the AI Era
Large language models can help users select statistical methods, operate analytical software, and understand the results.
For example, a user might enter:
“I want to investigate which manufacturing conditions affect product strength.”
An AI-assisted system could explain when multiple regression or Design of Experiments might be appropriate and what data would be required.
Another user might ask:
“I want to summarize 20 customer survey questions into a few evaluation dimensions.”
The system could explain the differences between PCA and factor analysis and help the user select a suitable method.
After the calculations are completed, an LLM can also explain regression coefficients, explained variance, factor loadings, classification accuracy, and other outputs in natural language.
However, the LLM should not be expected to invent or estimate numerical results without performing the required computations.
Statistical calculations should be conducted using established and validated numerical software.
The LLM is better suited to supporting the formulation of analytical objectives, method selection, result interpretation, and identification of potential problems.
One important risk is that AI can generate convincing explanations even when those explanations are unsupported.
For example, it may assign a plausible name to a principal component or invent a causal interpretation for an observed correlation.
Therefore, AI-generated explanations should remain connected to the original variables, numerical results, statistical models, and relevant data.
Multivariate Analysis in ThinkNavi
ThinkNavi approaches multivariate analysis not as an isolated specialist discipline, but as a collection of methods that can be selected according to the user’s purpose: problem discovery, causal investigation, hypothesis testing, prediction, classification, and decision-making.
For example, after developing possible causes with a Cause-and-Effect Diagram, users could employ multiple regression to investigate relationships between several variables and the observed outcome.
In customer research, information organized through the KJ Method could support questionnaire development and subsequent factor analysis.
When comparing products with numerous technical characteristics, PCA could help visualize their differences and provide information for decision-making.
ThinkNavi Free could progressively introduce tools for major multivariate methods, including data entry, statistical analysis, visualization, and presentation of essential numerical results.
An LLM-powered edition could assist users in describing their analytical problems in natural language, selecting suitable methods, checking data, configuring analyses, understanding results, and planning further investigations.
These are potential future capabilities, not descriptions of features currently available.
Users do not need to understand every mathematical derivation to benefit from multivariate analysis.
However, they should understand what each method is intended to accomplish, what data it requires, what results it produces, and which conclusions can and cannot be drawn from those results.
The essential value of multivariate analysis is not the complexity of its mathematics. It is the ability to discover relationships and structures in data that would remain difficult to understand by examining individual variables separately.
Related Topics
- What Is Statistics? — Discovering Patterns in Data and Understanding an Uncertain World
- Descriptive Statistics
- Correlation Analysis
- Regression and Multiple Regression Analysis
- Discriminant Analysis
- Principal Component Analysis
- Factor Analysis
- Cluster Analysis
- Design of Experiments (DOE) — Investigating Multiple Factors and Their Interactions Through Systematic Experimentation
- Cause-and-Effect Diagrams
- The KJ Method | Building Meaningful Structures from Fragmented Information
- Abduction | Reasoning Toward Explanations
- Decision Matrices
References and Further Reading
- Richard A. Johnson and Dean W. Wichern, Applied Multivariate Statistical Analysis, 6th ed., Pearson, 2007.
- T. W. Anderson, An Introduction to Multivariate Statistical Analysis, 3rd ed., Wiley, 2003.
- J. E. Jackson, A User’s Guide to Principal Components, Wiley, 1991.
- Pennsylvania State University — STAT 505: Applied Multivariate Statistical Analysis
- Pennsylvania State University — Multiple Linear Regression
- Pennsylvania State University — Discriminant Analysis
- Pennsylvania State University — Principal Components Analysis
- UCLA Statistical Consulting — Principal Components Analysis: Annotated Output
- NIST/SEMATECH — e-Handbook of Statistical Methods