

A Causal Loop Diagram (CLD) is a method for representing causal relationships among variables in a system using arrows and analyzing the feedback structures formed by those relationships. CLDs are used in Systems Thinking and System Dynamics to understand problems involving interacting factors, including those found in organizations, management, manufacturing, quality control, and environmental systems.
For example, suppose a company is experiencing an increasing number of customer inquiries and delays in responding to them. Hiring additional support staff may increase processing capacity and reduce the backlog. However, recruitment and training take time. Furthermore, delayed responses may cause customers to send follow-up inquiries, potentially increasing the workload.
A simple cause-and-effect explanation might state: “Customer inquiries increased, so the company hired additional staff.” In reality, however, the number of unresolved inquiries, support capacity, waiting times, and additional customer contacts may influence one another, producing changes over time.
A Causal Loop Diagram represents such relationships using variables whose values can increase or decrease and arrows indicating causal influences. By identifying feedback structures, it becomes possible to investigate why problems recur, why improvements take time to appear, and why short-term solutions sometimes fail to produce lasting results.
However, drawing an arrow in a Causal Loop Diagram does not establish that the causal relationship actually exists. Some relationships may be supported by observations or documents, while others may be hypotheses proposed by the analyst.
A Causal Loop Diagram is a tool for making causal hypotheses explicit, examining feedback structures, and understanding change over time. Its purpose is not simply to complete a diagram, but to investigate the mechanisms that generate problematic behavior and identify relationships that require verification.
The Background of Causal Loop Diagrams
Causal Loop Diagrams developed alongside Systems Thinking and System Dynamics.
System Dynamics was developed by Jay W. Forrester at MIT in the 1950s. It provided methods for examining production, inventory, distribution, and other business activities as dynamic systems involving feedback and time delays.
The methodology was subsequently applied to problems involving business management, cities, economies, environmental systems, energy, and other fields.
Causal Loop Diagrams are used to describe how variables within such systems influence one another and how these relationships form feedback loops.
John D. Sterman’s Business Dynamics (2000) provides a systematic explanation of CLD notation, variable naming, distinctions between causation and correlation, loop polarity, delays, and diagram construction.
Peter M. Senge’s The Fifth Discipline (1990) also helped popularize Systems Thinking and feedback concepts in organizational learning and management.
However, Causal Loop Diagrams do not represent the entirety of Systems Thinking. Systems Thinking is a broader approach encompassing interdependence, accumulation, change over time, and patterns of behavior emerging from interactions within a system.
This page focuses on the concepts and methods required to construct and analyze Causal Loop Diagrams.
Basic Elements of a Causal Loop Diagram
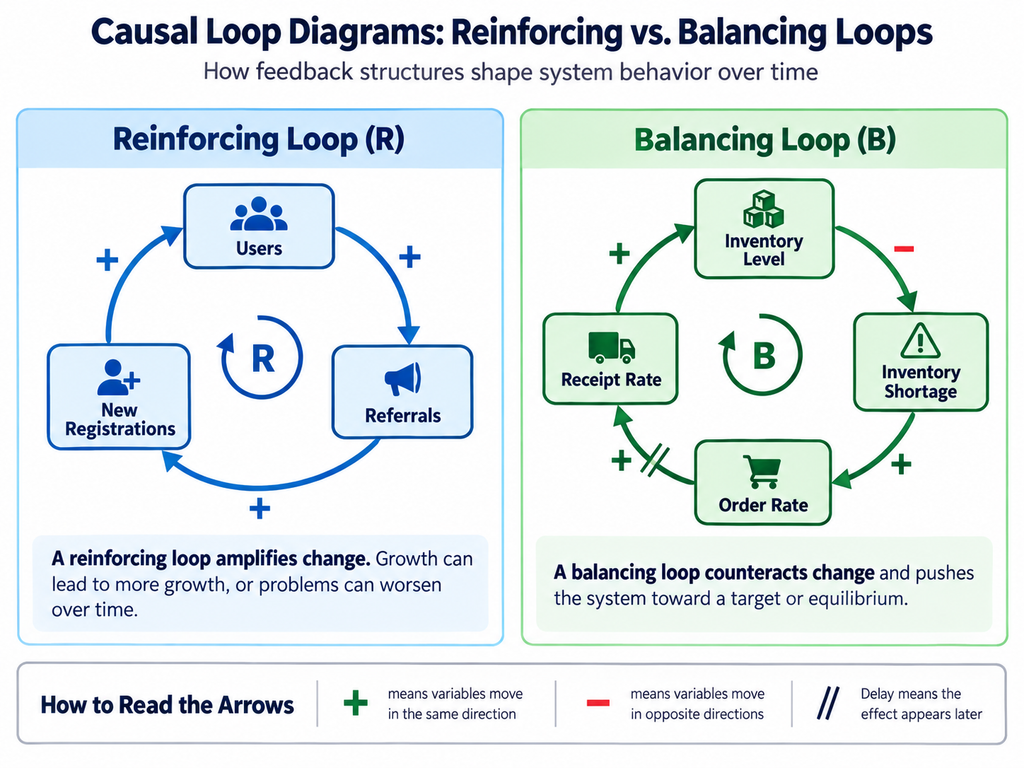
A Causal Loop Diagram typically includes the following elements.
| Element | Notation | Meaning |
|---|---|---|
| Variable | Noun or noun phrase | A quantity or state that can change over time |
| Causal Link | Arrow | The influence of one variable on another |
| Positive Polarity | + | The cause and effect tend to change in the same direction |
| Negative Polarity | − | The cause and effect tend to change in opposite directions |
| Reinforcing Loop | R | Feedback that amplifies an initial change |
| Balancing Loop | B | Feedback that counteracts an initial change |
| Delay | Double marks or another delay symbol on an arrow | A significant time interval between cause and effect |
The most important requirement is to define variables and arrows clearly.
Merely stating that two elements are related does not establish a causal link.
For example, even if advertising expenditure and sales revenue are statistically correlated, that does not prove that increasing advertising expenditure causes sales to increase.
Conversely, even where advertising can increase sales, the effect may depend on the product, customer segment, competitive environment, advertising content, and other conditions.
In a Causal Loop Diagram, it is necessary to examine what influences what, through which mechanisms, and under which conditions.
How to Name Variables
Variable names are important when constructing Causal Loop Diagrams.
As a general rule, a variable should represent a quantity or state whose value can increase or decrease.
Examples include customer satisfaction, inventory level, equipment utilization, and number of unresolved support requests.
Expressions that already contain a direction of change, such as “increasing customer satisfaction” or “decreasing inventory,” can create confusion when assigning causal polarity.
| Less Suitable Expression | Better Variable Name |
|---|---|
| Inventory is decreasing | Inventory Level |
| Customer satisfaction is improving | Customer Satisfaction |
| Equipment failures are increasing | Equipment Failure Rate |
| We are hiring more staff | Number of Available Support Staff |
| Responses are becoming slower | Average Response Time |
| Sales are declining | Sales Revenue |
However, variables such as “Defect Rate” or “Number of Unresolved Requests” are perfectly acceptable even though they describe undesirable conditions.
The important consideration is whether the consequences of an increase or decrease in the variable can be interpreted consistently.
For example, if a variable is named “Inventory Shortage,” it may be useful to clarify whether it refers to the quantity of missing inventory or the frequency of stockout events.
When a variable is ambiguous, its units and measurement method should also be specified.
What Do Positive and Negative Arrows Mean?
Correct interpretation of positive (+) and negative (−) polarity is essential.
Positive does not mean beneficial, and negative does not mean harmful.
A positive link indicates that, other things being equal, an increase in the cause variable tends to increase the effect variable relative to what it otherwise would have been.
For example:
Advertising Expenditure ──(+)──> Advertising-Driven Awareness
This represents the hypothesis that increasing advertising expenditure tends to increase awareness generated through advertising.
However, advertising efficiency may change, so the magnitude of the effect is not necessarily constant.
A negative link indicates that an increase in the cause variable tends to decrease the effect variable, other things being equal.
For example:
Product Price ──(−)──> Quantity Purchased
Under suitable conditions, increasing a product’s price may reduce the quantity purchased.
However, the relationship may differ depending on the product and market.
Positive and negative polarity describe the direction of a hypothesized influence under specified conditions.
| Change in Cause Variable | Positive Link (+) | Negative Link (−) |
|---|---|---|
| A increases | B tends to increase | B tends to decrease |
| A decreases | B tends to decrease | B tends to increase |
These relationships should be interpreted in a ceteris paribus sense: other relevant conditions are held constant.
They do not necessarily mean that two variables will actually move in the indicated directions at the same time.
For example, even if advertising contributes positively to sales, actual sales may decline because other factors exert a stronger negative influence.
Reinforcing Feedback Loops (R)
A Reinforcing Feedback Loop amplifies an initial change.
Consider a SaaS service in which the following relationships are assumed to hold:
Number of Users ──(+)──> User Referrals
User Referrals ──(+)──> New Registration Rate
New Registration Rate ──(+)──> Number of Users
The final relationship simplifies the accumulation of users through new registrations. A complete model would also need to consider cancellations and other outflows.
In this loop, more users generate more referrals, referrals increase registrations, and registrations further increase the user base.
This is an example of Reinforcing Feedback.
However, the existence of a Reinforcing Loop does not mean that the number of users will grow indefinitely.
Market size, limits to awareness, service quality, and customer churn may eventually constrain growth.
Reinforcing Feedback Can Also Produce Vicious Cycles
Reinforcing Feedback can amplify undesirable changes.
For example, consider the following relationships:
Defect Rate ──(+)──> Rework Volume
Rework Volume ──(+)──> Production Workload
Production Workload ──(+)──> Operational Error Rate
Operational Error Rate ──(+)──> Defect Rate
If these relationships hold, an increase in defects creates additional rework, increases production workload, and may generate further defects.
This is also Reinforcing Feedback.
The term reinforcing does not imply a positive outcome.
It describes a structural tendency to amplify changes in the same direction.
Balancing Feedback Loops (B)
A Balancing Feedback Loop counteracts an initial change.
Consider warehouse inventory management.
When inventory falls below its target level, the inventory shortage increases and orders are raised. As additional goods arrive, inventory rises and the shortage decreases.
A simplified representation is:
Inventory Level ──(−)──> Inventory Shortage
Inventory Shortage ──(+)──> Order Rate
Order Rate ──(+ with Delay)──> Receipt Rate
Receipt Rate ──(+)──> Inventory Level
This loop contains one negative causal link.
The loop therefore counteracts changes in inventory relative to the desired level and is classified as Balancing Feedback.
However, if deliveries take a long time, orders may accumulate before their effects are visible, potentially producing excessive inventory.
The existence of Balancing Feedback does not guarantee system stability.
This simplified example also omits the outflow of inventory through customer shipments. Quantitative inventory modeling requires consideration of both receipts and shipments.
How to Determine Loop Polarity
The polarity of a feedback loop can be determined from the polarities of the causal links forming the closed path.
A common method is to count the number of negative links.
| Number of Negative Links | Loop Classification |
|---|---|
| 0 | Reinforcing (R) |
| 1 | Balancing (B) |
| 2 | Reinforcing (R) |
| 3 | Balancing (B) |
| 4 | Reinforcing (R) |
In general, a loop with an even number of negative links is Reinforcing, while a loop with an odd number is Balancing.
Consider:
A ──(−)──> B
B ──(−)──> C
C ──(+)──> A
There are two negative links.
An increase in A tends to decrease B. A decrease in B tends to increase C. An increase in C then tends to increase A further.
The overall loop is therefore Reinforcing.
This classification assumes that the link polarities are valid over the conditions under consideration and that the variables have been clearly defined.
However, loop polarity alone does not determine whether the actual system will grow, decline, oscillate, or stabilize.
Its behavior also depends on the strength of the relationships, delays, and interactions with other feedback loops.
When Multiple Feedback Loops Operate Simultaneously
Real systems often contain both Reinforcing and Balancing Feedback Loops.
Consider a SaaS service in which an increasing user base generates referrals and additional registrations.
This forms a Reinforcing Loop.
At the same time, growth in the customer base may increase support workload, reduce response quality, and contribute to higher churn.
This can form a Balancing Loop that limits growth.
| Loop | Main Relationships | Function |
|---|---|---|
| R1: Referral-Driven Growth | More Users → More Referrals → More Registrations → More Users | Encourages growth |
| B1: Support Capacity Constraint | More Users → Higher Support Workload → Lower Service Quality → More Cancellations → Fewer Users | Restrains growth |
Initially, the Reinforcing Loop may dominate.
As the user base grows, however, capacity constraints may strengthen the Balancing Loop, reducing the growth rate.
The diagram alone cannot determine the relative strengths of these loops.
External influences, such as changes in competition or pricing, may also affect the number of users.
Representing multiple loops helps organize possible explanations of system behavior, but additional information is needed to evaluate their actual effects.
How to Represent Delays
Causal Loop Diagrams can indicate significant delays between changes in a cause variable and the resulting effects.
A common notation uses two short parallel marks across a causal arrow.
For example:
Recruitment Effort ──(+ with Delay)──> Available Support Staff
Increasing recruitment effort does not immediately increase the number of employees capable of handling support requests.
Applications, interviews, hiring, and training all take time.
The importance of delays lies not merely in their existence, but in the fact that further decisions may be made before the consequences of earlier actions become visible.
Suppose a company decides to hire more support staff because the backlog is growing.
Before the new employees become productive, the backlog continues to increase, prompting another round of recruitment.
When the results of several hiring decisions eventually appear, staffing may exceed actual requirements.
However, delays do not necessarily cause overadjustment.
The outcome depends on decision rules, delay lengths, changes in workload, and the methods used to forecast future demand.
Practical Example 1 — A Customer Support Backlog
Consider a company trying to understand its growing backlog of unresolved customer support requests.
The problem can be formulated as follows:
“Why does the backlog sometimes continue to grow after incoming inquiries increase, and how much improvement can additional support staff produce?”
Relevant variables might include:
| Variable | Meaning |
|---|---|
| Unresolved Support Requests | Number of inquiries that have not yet been resolved |
| New Inquiry Arrival Rate | Number of new inquiries received per unit of time |
| Resolution Rate | Number of inquiries resolved per unit of time |
| Available Support Staff | Number of employees capable of handling inquiries |
| Average Waiting Time | Average time between an inquiry and a response |
| Follow-Up Inquiry Rate | Rate at which customers submit additional inquiries or reminders |
The number of unresolved requests changes according to the difference between incoming requests and completed resolutions.
As the backlog grows, average waiting times may increase.
Longer waiting times may cause customers to submit additional reminders or inquiries.
If these additional contacts generate separate work items, they may further increase the backlog.
Meanwhile, an increasing backlog may prompt management to hire additional support staff.
The resulting increase in processing capacity may eventually reduce the number of unresolved requests.
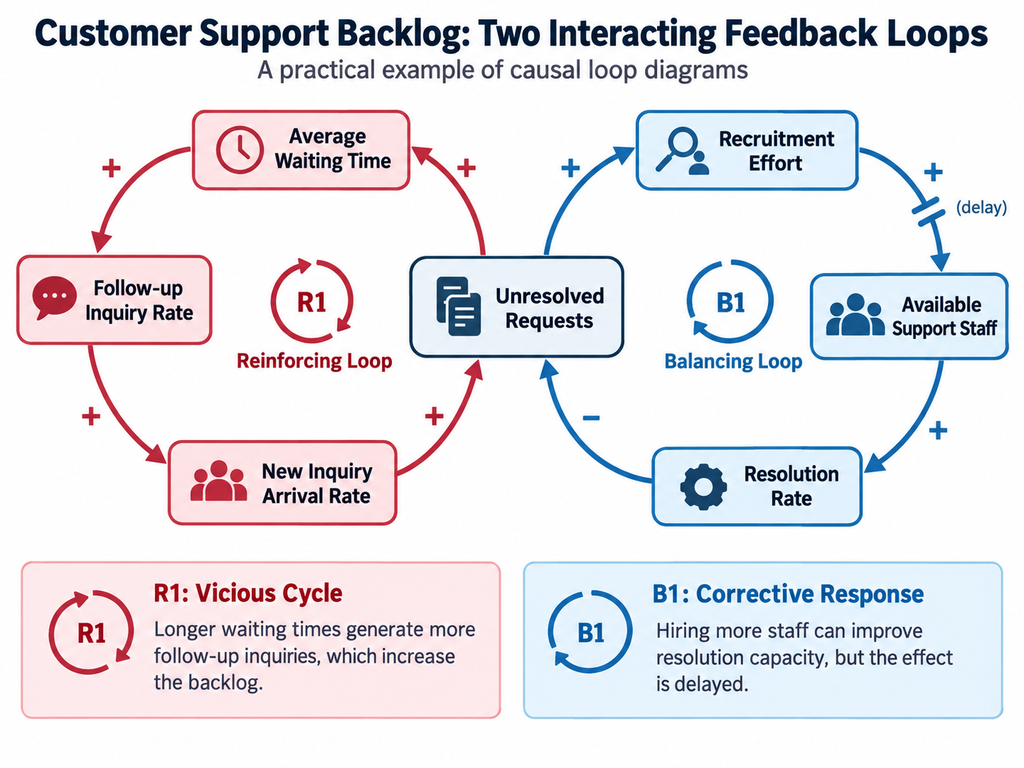
A Candidate Reinforcing Loop
Unresolved Requests ──(+)──> Average Waiting Time
Average Waiting Time ──(+)──> Follow-Up Inquiry Rate
Follow-Up Inquiry Rate ──(+)──> New Inquiry Arrival Rate
New Inquiry Arrival Rate ──(+)──> Unresolved Requests
This is a candidate Reinforcing Loop.
However, the loop may not apply if reminders are simply appended to existing cases rather than creating additional work.
A Candidate Balancing Loop
Unresolved Requests ──(+)──> Recruitment Effort
Recruitment Effort ──(+ with Delay)──> Available Support Staff
Available Support Staff ──(+)──> Resolution Rate
Resolution Rate ──(−)──> Unresolved Requests
This is a candidate Balancing Loop.
The important point is that the two loops may operate simultaneously.
Other relationships may also exist. For example, an increasing backlog may affect workload and employee fatigue, which in turn could influence resolution rates.
However, understanding the actual problem requires investigating which relationships are important and whether they are supported by ev
Practical Example 2 — Manufacturing Quality and Production Workload
Manufacturers sometimes increase equipment utilization or overtime to address delivery delays.
However, if higher production workload increases operational errors or equipment problems, additional rework may be required.
This could increase production workload even further.
Consider the following hypothetical relationships:
| Cause Variable | Polarity | Effect Variable |
|---|---|---|
| Production Workload | + | Operational Error Rate |
| Operational Error Rate | + | Defect Rate |
| Defect Rate | + | Rework Volume |
| Rework Volume | + | Production Workload |
Because the loop contains no negative links, it is a Reinforcing Loop.
If these relationships operate, increasing production workload may worsen problems over the longer term.
However, the actual effects may differ if higher workload does not increase errors or if rework can be handled by separate equipment.
Maintenance capacity, employee skills, and automation may also influence the outcome.
It is therefore necessary to determine whether the hypothesized loop exists in the actual production system.
Such analysis may suggest alternatives to simply increasing production hours, including reducing defects and rework to relieve production pressure.
Practical Example 3 — R&D Investment and Dependence on Established Technologies
In R&D management, concentrating resources on established technologies may be reasonable because they can produce more predictable short-term results.
However, investment allocation and performance evaluation systems may also discourage exploration of unfamiliar technologies.
Relevant variables might include:
| Variable | Meaning |
|---|---|
| Short-Term Results from Established Technologies | Outcomes achieved through incremental improvements |
| Investment Share for Established Technologies | Proportion of R&D resources devoted to existing technologies |
| Investment Share for New Technology Exploration | Proportion devoted to new or cross-domain fields |
| Number of New-Domain Research Candidates | Research opportunities generated from unfamiliar technological fields |
| Dependence on Established Technologies | Extent to which R&D activity is concentrated on existing technologies |
One possible hypothesis is that success in established technologies encourages further investment in those fields, reducing exploration of new domains.
However, this is only one possible explanation. It does not necessarily describe every R&D organization.
Investing in successful established technologies may also be economically appropriate.
The purpose of a Causal Loop Diagram is not to determine automatically which investments are correct.
It is to examine how resource allocation and performance evaluation systems may influence an organization’s technological options over time.
A Practical Procedure for Constructing Causal Loop Diagrams
Several approaches to constructing Causal Loop Diagrams exist.
The following procedure provides a practical framework.
| Stage | Activity | Main Question |
|---|---|---|
| 1. Define the Problem | Identify the behavior to be explained | What is changing, and how has it changed over time? |
| 2. Set the Scope | Define the system boundary and time horizon | What should be included or excluded? |
| 3. Identify Variables | Describe important factors as quantities that can change | Are variable names clear? |
| 4. Propose Causal Links | Connect variables through hypothesized influences | Does the arrow represent a causal relationship? |
| 5. Assign Polarities | Mark links as positive or negative | Can the direction of influence be explained? |
| 6. Identify Feedback Loops | Find closed causal paths | Is each loop Reinforcing or Balancing? |
| 7. Examine Delays | Identify important time intervals | When do the effects become visible? |
| 8. Review the Structure | Examine interactions and missing variables | Does the model adequately explain the problem? |
| 9. Verify Relationships | Compare hypotheses with observations and evidence | Are the relationships consistent with reality? |
| 10. Consider Interventions | Compare possible improvements | Which relationships or structures should be changed? |
These stages need not be performed in a strictly linear sequence.
Examining a causal link may reveal the need for additional variables.
Constructing a diagram may also show that the original problem formulation needs revision.
Not every problem necessarily involves a feedback loop.
If no convincing loop can be identified, it is better to retain an open causal structure than to invent a circular relationship merely to complete the diagram.
Observe Behavior Before Drawing the Diagram
Before proposing causal relationships, it is important to examine the behavior that needs to be explained.
For example, when investigating unresolved support requests, the historical development of the backlog should be examined.
A steadily increasing backlog, a temporary spike, and recurring fluctuations may suggest different mechanisms.
Additional data about inquiry arrival rates, resolution rates, and average waiting times can help clarify what is changing.
Graphs used to represent such historical patterns are often called Behavior over Time Graphs.
| Observed Behavior | Structures Worth Investigating |
|---|---|
| Continuous Growth | Reinforcing Feedback, sustained inflow exceeding outflow, etc. |
| Movement Toward a Target | Balancing Feedback, etc. |
| Periodic Fluctuation | Delayed adjustments, external cyclical influences, etc. |
| Growth Followed by Stagnation | Emerging constraints or feedback limiting growth |
| Sudden Change | Thresholds, external shocks, nonlinear relationships, etc. |
However, observed behavior does not uniquely identify its underlying causal structure.
For example, periodic fluctuations do not necessarily result from internal Balancing Feedback with delays.
They may instead be caused by external seasonal or cyclical factors.
Observing behavior provides a starting point for investigating causal mechanisms.
Common Mistakes in Causal Loop Diagrams
Causal Loop Diagrams are relatively easy to draw, which can make incorrect applications seem convincing.
| Problem | Why It Matters | Possible Improvement |
|---|---|---|
| Variable names include directions of change | Expressions such as “Increasing Sales” can make polarity ambiguous | Use quantities such as “Sales Revenue” |
| Correlation is treated as causation | Variables may change together without a direct causal relationship | Examine causal mechanisms and alternative explanations |
| Ambiguous link polarity | The direction of influence cannot be explained | Revise variable definitions and assumptions |
| Indirect relationships are shown as direct links | Important intermediate mechanisms may be omitted | Add relevant intermediate variables |
| Delays are ignored | Effects appear to occur immediately | Mark significant delays |
| Loops are closed artificially | Feedback relationships may be invented | Allow open causal structures when appropriate |
| Too many variables are included | The diagram becomes difficult to understand | Limit scope according to the problem |
| Hypotheses are treated as established facts | Unverified relationships appear authoritative | Record verification status explicitly |
One particularly important problem is that completing a visually coherent diagram may create the impression that the system has been understood.
However, a well-formed diagram is not necessarily an accurate representation of reality.
Even when every arrow has a polarity and several loops close neatly, the depicted relationships may not exist in the actual system.
How Can Causal Relationships Be Verified?
Each arrow in a Causal Loop Diagram can be treated as a hypothesis requiring examination.
For example, consider:
“Increasing the number of support staff raises the resolution rate.”
One approach would be to compare historical staffing levels with the number of requests resolved.
However, observing that staffing and resolution rates increase together does not establish a causal relationship.
The company may have improved its support software during the same period, or the average complexity of inquiries may have decreased.
Several questions can help guide verification.
| Perspective | Main Question |
|---|---|
| Existence of a Relationship | Are changes in the proposed cause associated with changes in the outcome? |
| Temporal Order | Does the proposed cause precede the effect? |
| Mechanism | Why should this variable influence the outcome? |
| Alternative Explanations | Could another factor explain the observed relationship? |
| Conditions | Under what circumstances does the relationship hold? |
| Strength | How large is the effect? |
| Delay | How long does it take for the effect to appear? |
Where feasible, experiments, quasi-experimental designs, and time-series analysis may provide useful evidence.
However, organizational and social problems do not always allow every causal relationship to be tested experimentally.
Even in such cases, it is important to distinguish verified relationships from untested hypotheses.
Causal Loop Diagrams and Stock-and-Flow Diagrams
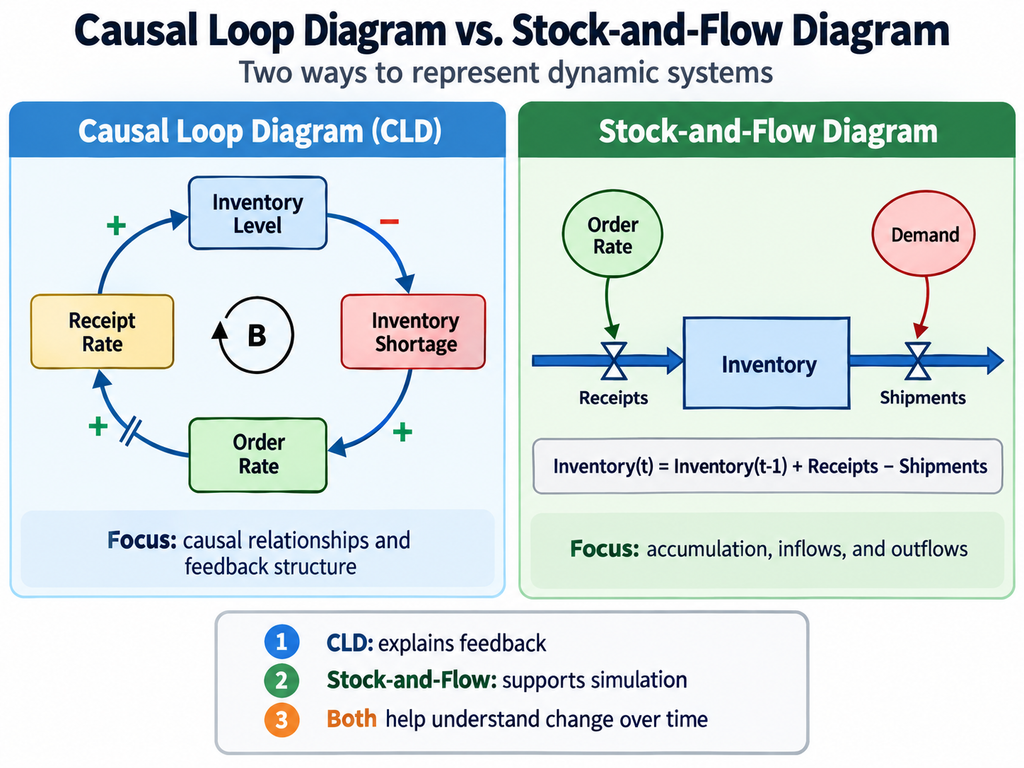
Causal Loop Diagrams and Stock-and-Flow Diagrams are both used in System Dynamics, but they serve different purposes.
A Causal Loop Diagram represents influences among variables and feedback structures.
A Stock-and-Flow Diagram identifies what accumulates and how inflows and outflows change those accumulations.
| Perspective | Causal Loop Diagram | Stock-and-Flow Diagram |
|---|---|---|
| Main Purpose | Understand feedback structures | Represent accumulation and rates of change |
| Main Elements | Variables, causal links, feedback loops | Stocks, flows, auxiliary variables |
| Treatment of Time | Supports qualitative reasoning about dynamic behavior | Supports calculations using equations |
| Numerical Simulation | Usually not possible from the diagram alone | Possible with an appropriate mathematical model |
| Main Limitation | Relationships and polarities may be incorrect | Equations and parameters require validation |
Consider a customer support backlog.
The number of unresolved requests is a Stock.
New inquiry arrival is an Inflow.
Request resolution is an Outflow.
Let (B(t)) represent the backlog, (I(t)) the inquiry arrival rate, and (O(t)) the resolution rate.
A simplified model is:
[
\frac{dB(t)}{dt}=I(t)-O(t)
]
This equation represents accumulation explicitly, something that may not be clear from causal arrows alone.
The units also differ.
The backlog may be measured in requests, while arrival and resolution rates are measured in requests per day.
Distinguishing quantities from rates is essential when constructing mathematical models.
A Causal Loop Diagram can help clarify a problem’s feedback structure before a Stock-and-Flow Model is developed.
However, automatic conversion from a CLD to a valid Stock-and-Flow Model is not always pos
Causal Loop Diagrams and Logic Trees
Logic Trees are used to decompose subjects or problems into constituent parts.
For example, manufacturing costs may be divided into material costs, labor costs, and overhead.
A Causal Loop Diagram, by contrast, examines how the relevant factors influence one another.
For example, reducing material expenditure might affect material quality, which may influence defect rates, rework costs, and ultimately total manufacturing costs.
| Perspective | Logic Tree | Causal Loop Diagram |
|---|---|---|
| Main Purpose | Decompose subjects and problems | Represent causal influences and feedback |
| Structure | Hierarchy | Network with potentially circular paths |
| Relationships | Composition, classification, decomposition of causes or measures | Causal influence |
| Delays | Usually not central | Explicitly represented when important |
| Main Output | Organized issues and components | Hypotheses about feedback structure |
The two methods can be used together.
For example, a Logic Tree may help identify relevant components of a problem, after which a Causal Loop Diagram can examine their interactions.
Causal Loop Diagrams and Concept Maps
Concept Maps represent semantic relationships among concepts.
For example:
“A pump transports a fluid.”
“A material is a component of a product.”
Causal Loop Diagrams represent causal influences among variables whose values can change.
For example:
“An increase in pump rotational speed tends to increase flow rate under specified operating conditions.”
This statement differs from the general conceptual relationship that a pump transports fluid.
It describes a causal influence that depends on particular operating conditions.
Consequently, relationships in Concept Maps or Knowledge Graphs should not automatically be converted into causal arrows.
Relationships such as “related to,” “part of,” “used for,” and “influences” have different meanings.
However, causal relationships identified within a Concept Map may provide useful candidates for inclusion in a Causal Loop Diagram.
The Relationship Between Causal Loop Diagrams and Structure-Mapping Theory
Causal Loop Diagrams describe causal influences and feedback structures within a system.
Structure-Mapping Theory, by contrast, explains correspondences between relational structures in different domains.
The two approaches are not identical.
Nevertheless, causal structures represented in one system can potentially be compared with those in another.
For example, suppose an organization exhibits the following pattern:
“Activities producing short-term success attract more resources, which make those activities even more likely to succeed.”
A similar pattern of resource allocation and success might exist in another organization or technological domain.
It may therefore be possible to compare the relational structures underlying the two situations.
However, similarity between the shapes of two causal diagrams does not establish that the systems will behave identically.
The strengths of the relationships, delays, component characteristics, and external conditions may differ.
Furthermore, Structure-Mapping Theory is not restricted to causal relationships.
When combining Causal Loop Diagrams with structural analogy, the meanings and conditions of the corresponding relationships must be examined carefully.
When Should Causal Loop Diagrams Be Used?
Causal Loop Diagrams are particularly useful when several factors influence one another and the resulting behavior changes over time.
Examples include inventory fluctuations, customer acquisition and churn, production workload and quality, equipment maintenance and breakdowns, and investment-driven growth.
However, when a problem has a clearly defined technical cause, conventional cause analysis or experimentation may be more appropriate.
For example, investigating why a machine component fractured may require engineering analysis of materials, stresses, and fatigue.
A Causal Loop Diagram is not a substitute for such analysis.
On the other hand, investigating why the damaged component continued to be used without replacement might reveal feedback involving maintenance scheduling, production targets, and organizational decision-making.
The important principle is not to explain every problem using Causal Loop Diagrams.
The method should be selected according to the nature of the problem.
LLM-Assisted Causal Loop Diagram Construction
Large Language Models can be used to extract candidate variables and causal relationships from natural-language descriptions.
For example, consider the following description:
“Customer inquiries are increasing, and response times are becoming longer. The company is considering hiring additional staff, but recruitment and training take time. Customers are also sending more follow-up inquiries because responses are delayed.”
An AI system could identify variables such as unresolved request count, available support staff, resolution rate, average waiting time, and follow-up inquiry rate.
It could then propose causal links among them.
| Function | Possible AI Operation |
|---|---|
| Variable Extraction | Identify quantities that can increase or decrease |
| Variable Normalization | Standardize different expressions referring to the same variable |
| Causal Link Suggestion | Propose possible influences among variables |
| Polarity Suggestion | Suggest positive or negative link polarity |
| Loop Detection | Identify closed paths in the causal network |
| Delay Identification | Suggest relationships involving significant delays |
| Missing Variable Suggestions | Identify possible intermediate or omitted variables |
| Verification Planning | Identify causal hypotheses requiring investigation |
However, LLM-generated causal relationships require careful evaluation.
An LLM may produce plausible relationships among customer satisfaction, inquiry volume, and support quality without establishing whether those relationships operate in a particular company.
LLMs may also assign incorrect link polarities.
This can be especially problematic when variable names contain negative expressions or when important intermediate variables are omitted.
AI-generated diagrams should therefore be treated as candidates for examination, not completed descriptions of reality.
Human analysts should evaluate the meaning and evidence supporting each link.
How Should AI-Assisted Causal Models Be Recorded?
When Causal Loop Diagrams are used repeatedly, it may be useful to store variables and causal links in a structured form.
For variables, the following fields could be maintained.
| Field | Description |
|---|---|
| Variable ID | Unique identifier |
| Variable Name | Inventory Level, Failure Rate, etc. |
| Definition | What the variable represents |
| Unit | Units, requests per day, percentage, etc. |
| Observed Data | Measurements that can be obtained |
| Analysis Period | Relevant time horizon |
Causal links could be stored using the following fields.
| Field | Description |
|---|---|
| Link ID | Unique identifier for the relationship |
| Cause Variable | Variable believed to exert an influence |
| Effect Variable | Variable believed to be influenced |
| Polarity | Positive or negative |
| Delay | Time required for the effect to appear |
| Conditions | Circumstances under which the relationship holds |
| Supporting Evidence | Observations, experiments, studies, documents |
| Verification Status | Verified, unverified, conditional, etc. |
This makes it possible to examine not only the visual structure of a diagram but also the evidence associated with individual relationships.
Causal hypotheses could also be reconsidered when new information becomes available.
However, structured storage does not automatically verify causal relationships.
Limitations of Causal Loop Diagrams
Causal Loop Diagrams are useful for understanding complex problems, but several limitations must be recognized.
First, a Causal Loop Diagram does not prove causation. Relationships proposed by the analyst may not exist in reality.
Second, link polarity does not indicate the strength of an influence. Weak and strong relationships may be represented using the same symbols.
Third, marking a delay does not normally specify whether the delay lasts days, months, or years.
Fourth, when multiple feedback loops exist, the diagram alone may not reveal which loop dominates the system’s actual behavior.
Fifth, the structure of the diagram depends on which variables are selected and where the system boundary is placed.
Sixth, excessively complex diagrams can obscure the particular behavior they are intended to explain.
Seventh, predicting numerical outcomes or evaluating the effectiveness of interventions may require Stock-and-Flow Models, mathematical models, statistical analysis, or other methods.
Finally, judgments about desirable outcomes depend partly on the values and priorities of analysts and stakeholders.
A Causal Loop Diagram cannot automatically determine which intervention should be chosen.
A Causal Loop Diagram is a representation used to investigate system structure. Additional evidence and analysis are required to determine whether that structure exists in reality and whether a proposed intervention will be effective.
Causal Loop Diagrams in ThinkNavi
ThinkNavi treats Causal Loop Diagrams as a representative practical tool for applying Systems Thinking.
The separate page on Systems Thinking explains broader concepts such as interdependence, feedback, and change over time.
This page focuses on the actual construction and interpretation of causal structures using variables, links, polarities, loops, and delays.
For ThinkNavi Free, one possible implementation would allow users to enter variables manually, connect them through causal links, and assign polarity and delay information.
The system could also detect closed loops, classify them as Reinforcing or Balancing, and check the consistency of variable names and link definitions.
Some of these functions can be implemented using graph algorithms and straightforward computations without an LLM.
For example, graph traversal can identify closed paths, and counting negative links along a path can determine loop polarity.
However, graph structure alone cannot establish whether the causal relationships are correct.
Potential LLM-assisted features include extracting variables and candidate causal links from documents, suggesting implicit assumptions, and identifying missing variables.
The system could also record evidence and conditions associated with each link, distinguishing unverified causal hypotheses from relationships supported by observation or experimentation.
A further possible development would be to construct Stock-and-Flow Models and run numerical simulations.
However, converting a Causal Loop Diagram into a mathematical model requires definitions of units, equations, parameters, and initial conditions.
Knowledge exploration systems such as ConceptMiner R&D may also benefit from extracting causal and control relationships from technical documents and comparing mechanisms across different technological systems.
However, semantic similarity between documents, relational correspondence in Structure-Mapping Theory, and feedback in Causal Loop Diagrams represent different concepts.
When combining these approaches, the meaning of each type of relationship must remain explicit.
These are possible directions for future development and do not imply that all such functions are currently available.
The important objective of using Causal Loop Diagrams is not to construct increasingly complicated diagrams or force every variable into a feedback loop.
It is to identify how a problem changes over time, formulate hypotheses about the relationships generating that behavior, and investigate the evidence necessary to evaluate those hypotheses.
Causal Loop Diagrams help us understand problems not simply as the consequences of individual causes, but as the outcomes of structures in which multiple factors influence one another. They are particularly valuable when actions intended to solve a problem eventually feed back into the problem itself.
Related Topics
- Systems Thinking — Understanding Interdependence, Feedback, and Change Over Time
- Logical Thinking — Building Sound Arguments, Communicating Reasoning, and Achieving Mutual Understanding
- Logic Trees and Issue Trees — Breaking Down Problems and Identifying the Questions That Need Answers
- Problem Structuring — Breaking Down Problems, Understanding Relationships, and Finding Paths to Solutions
- Root Cause Analysis (RCA) — Understanding Why Problems Occur and Preventing Recurrence
- Five Whys | Exploring Root Causes by Repeatedly Asking “Why?”
- KPI Trees — Decomposing Performance Goals and Identifying Levers for Improvement
- Concept Maps — Representing Relationships Between Concepts and Understanding Knowledge Structures
- Structure-Mapping Theory | Understanding Relational Correspondences and Generating New Inferences Across Domains
- Analogy — Connecting Knowledge Across Domains to Generate New Ideas and Hypotheses
- Induction, Deduction, and Abduction — Discovering Patterns, Drawing Conclusions, and Generating New Hypothese
- The Scientific Method and Falsifiability — Generating Hypotheses and Testing Them Critically
- Design of Experiments (DOE) — Investigating Multiple Factors and Their Interactions Through Systematic Experimentation
- Multivariate Analysis — Discovering Relationships and Structures Among Multiple Variables
- Qualitative and Quantitative Thinking — Two Perspectives on Understanding the World and Their Integration
- Scenario Analysis | Explore Uncertain Futures
- Critical Thinking | Examining Claims and Evidence
- Concept Exploration
References and Further Reading
- Jay W. Forrester, Industrial Dynamics, MIT Press, 1961.
- John D. Sterman, Business Dynamics: Systems Thinking and Modeling for a Complex World, Irwin/McGraw-Hill, 2000. MIT Faculty Page
- Donella H. Meadows, Thinking in Systems: A Primer, Chelsea Green Publishing, 2008.
- Peter M. Senge, The Fifth Discipline: The Art & Practice of the Learning Organization, Doubleday, 1990.
- The Systems Thinker — Guidelines for Drawing Causal Loop Diagrams
- The Systems Thinker — Pocket Guide: Guidelines for Drawing Causal Loop Diagrams
- The Open University — Causal Loop Diagrams
- MIT OpenCourseWare — Introduction to Engineering Systems
- MIT Sloan School of Management — System Dynamics
- Donella H. Meadows — Leverage Points: Places to Intervene in a System
- George P. Richardson, Feedback Thought in Social Science and Systems Theory, University of Pennsylvania Press, 1991.
- John W. Morecroft, Strategic Modelling and Business Dynamics: A Feedback Systems Approach, Wiley, 2007.
- isee systems — System Dynamics and Modeling Resources