

A KPI Tree (Key Performance Indicator Tree) is a method for decomposing high-level performance objectives into more specific indicators and organizing the relationships among them. It helps organizations identify which factors should be improved to achieve their overall goals.
By representing relationships hierarchically, a KPI Tree can connect objectives such as revenue, profit, quality, equipment utilization, and customer satisfaction with more specific factors that contribute to their performance.
For example, the objective “Increase revenue” does not, by itself, indicate what should be improved.
However, decomposing revenue into sales quantity and average selling price allows managers to consider whether growth should come from increasing sales volume, improving pricing, or both.
Further decomposition may reveal opportunities involving customer acquisition, purchasing frequency, product mix, or discount policies.
In this way, KPI Trees help translate abstract business objectives into measurable indicators that can guide analysis and improvement activities.
However, an important distinction must be made.
Connecting two indicators in a KPI Tree does not necessarily establish that a causal relationship exists between them. Some relationships follow directly from mathematical definitions, while others are hypotheses that require empirical verification.
For example, the proposition that higher employee satisfaction leads to increased revenue may sound reasonable, but it cannot be established simply by drawing a connecting line.
KPI Trees are useful for decomposing objectives and identifying potential levers for improvement. However, treating every relationship in the tree as necessarily valid can lead to misleading interpretations of reality.
What Is a KPI?
KPI stands for Key Performance Indicator. A KPI is a measure selected to monitor progress toward an important organizational or business objective.
Examples include:
- Revenue
- Operating profit
- Customer count
- Customer retention rate
- Defect rate
- On-time delivery rate
- Equipment utilization
- Customer support response time
- Customer satisfaction
However, not every measurable value should be regarded as a KPI.
A KPI should be sufficiently important to the objective and useful for ongoing observation and management.
KPIs also usually exist in relation to higher-level objectives and other indicators.
For example, improving operating profit may involve revenue, gross margin, selling expenses, and administrative costs.
Improving manufacturing quality may involve defect rates, rework rates, equipment downtime, and process capability indices.
A KPI Tree helps organize relationships among such indicators.
The Basic Principle of KPI Trees
The central idea of a KPI Tree is to decompose a higher-level performance indicator into lower-level indicators that contribute to or are associated with it.
The objective is not simply to create a hierarchy of numbers.
It is to understand which indicators can be influenced and how changes in those indicators may affect overall performance.
For example, operating profit can be expressed as:
Operating Profit = Revenue − Cost of Goods Sold − Selling, General and Administrative Expenses
Revenue can then be decomposed as:
Revenue = Sales Quantity × Average Selling Price
Here, Average Selling Price is defined as revenue divided by the quantity sold during the relevant period.
This decomposition reveals several possible directions for improving operating profit:
- Increase revenue.
- Reduce the cost of goods sold.
- Reduce selling, general and administrative expenses.
- Improve the product mix or other factors influencing the above indicators.
Revenue growth can be examined further through changes in sales quantity, pricing, or both.
KPI Trees thus connect higher-level objectives with more specific analytical and operational considerations.
The Relationship Between KPI Trees and Logic Trees
A KPI Tree can be understood as a particular application of a Logic Tree.
Logic Trees are general-purpose methods for decomposing subjects, problems, causes, or possible actions into hierarchical structures.
KPI Trees focus specifically on quantitative performance indicators and their relationships.
For example, a Logic Tree investigating declining revenue might explore pricing, sales quantity, competitive conditions, sales organization, and product competitiveness.
A KPI Tree would concentrate on measurable indicators such as revenue, sales quantity, average selling price, customer count, and purchasing frequency.
| Perspective | Logic Tree | KPI Tree |
|---|---|---|
| Main Subject | Problems, causes, actions, components | Quantitative and performance indicators |
| Main Purpose | Problem decomposition and issue organization | Organizing indicator relationships and identifying improvement opportunities |
| Representation | May consist of concepts or questions | Primarily consists of measurable indicators |
| Relationships | What, Why, How, and other relationships | Mathematical, aggregation-based, or hypothesized relationships |
| Typical Applications | General problem-solving | Performance management and continuous improvement |
KPI Trees offer a more quantitative representation than general Logic Trees.
However, this also means that factors difficult to express numerically may receive insufficient attention.
How to Construct a KPI Tree
There is no single mandatory procedure for constructing a KPI Tree.
Nevertheless, the following activities provide a practical framework.
| Step | Activity | Important Consideration |
|---|---|---|
| 1. Define the objective | Clarify what needs to be achieved or improved | Is the objective sufficiently clear? |
| 2. Select the top-level indicator | Choose a measure representing the objective | Can it be measured meaningfully? |
| 3. Decompose the indicator | Identify components and related lower-level indicators | Distinguish definitions from hypotheses |
| 4. Identify improvement levers | Determine which indicators can be influenced | Are they within the organization’s control? |
| 5. Prioritize indicators | Evaluate importance, improvement potential, and feasibility | Avoid pursuing everything simultaneously |
| 6. Establish measurement procedures | Define data sources, frequency, and responsibilities | Are the indicators measurable and reliable? |
| 7. Implement and review | Apply improvements and revise the structure | Do not treat the initial tree as permanent |
1. Define the Objective
The first step is to clarify why the indicators are being managed.
The KPI Tree will differ depending on whether the objective is revenue growth, profit improvement, quality enhancement, or customer retention.
For example, “Grow the business” is too broad to provide clear analytical direction.
More specific objectives might include:
“Improve the operating profit margin of the existing product business.”
“Reduce the manufacturing defect rate by 50%.”
“Reduce customer churn.”
The objective should be sufficiently concrete to guide the selection of relevant indicators.
2. Select the Top-Level Indicator
Next, select a measure that appropriately represents the objective.
Possible indicators include operating profit margin, revenue, defect rate, and customer retention rate.
However, the objective itself should sometimes be distinguished from the indicator used to represent it.
For example, the objective “Strengthen long-term customer relationships” may be monitored through retention rates or repeat purchase rates.
Nevertheless, those indicators may not fully capture the quality of the relationships.
A quantitative indicator is a representation of an objective, not necessarily the objective itself.
3. Decompose into Lower-Level Indicators
The top-level indicator is decomposed into its components or related indicators.
At this stage, it is essential to distinguish relationships established by definition from relationships that remain hypotheses.
For example:
“Revenue equals sales quantity multiplied by average selling price.”
This follows from the definitions of the indicators.
By contrast:
“Increasing the number of sales visits increases the conversion rate.”
This is a hypothesis whose validity may depend on the industry, sales process, and customer characteristics.
If the distinction is ignored, the entire KPI Tree may appear mathematically certain even when some relationships are only assumed.
4. Identify Controllable Improvement Levers
The purpose of a KPI Tree is not simply decomposition.
It is to identify factors that can realistically be improved.
For example, exchange rates may affect operating profit margins, but an individual company generally cannot directly control them.
By contrast, discount rates, product mix, defect rates, and setup times may be influenced through operational decisions.
An effective KPI Tree should distinguish factors that can be controlled from factors that can only be monitored or anticipated.
5. Prioritize Indicators
Attempting to improve every lower-level indicator simultaneously is rarely practical.
Indicators should be prioritized according to their potential impact on the overall objective, available improvement opportunities, and feasibility.
Pareto Analysis, impact assessments, and hypothesis testing may be useful at this stage.
The objective is to concentrate effort on the changes most likely to produce meaningful improvements.
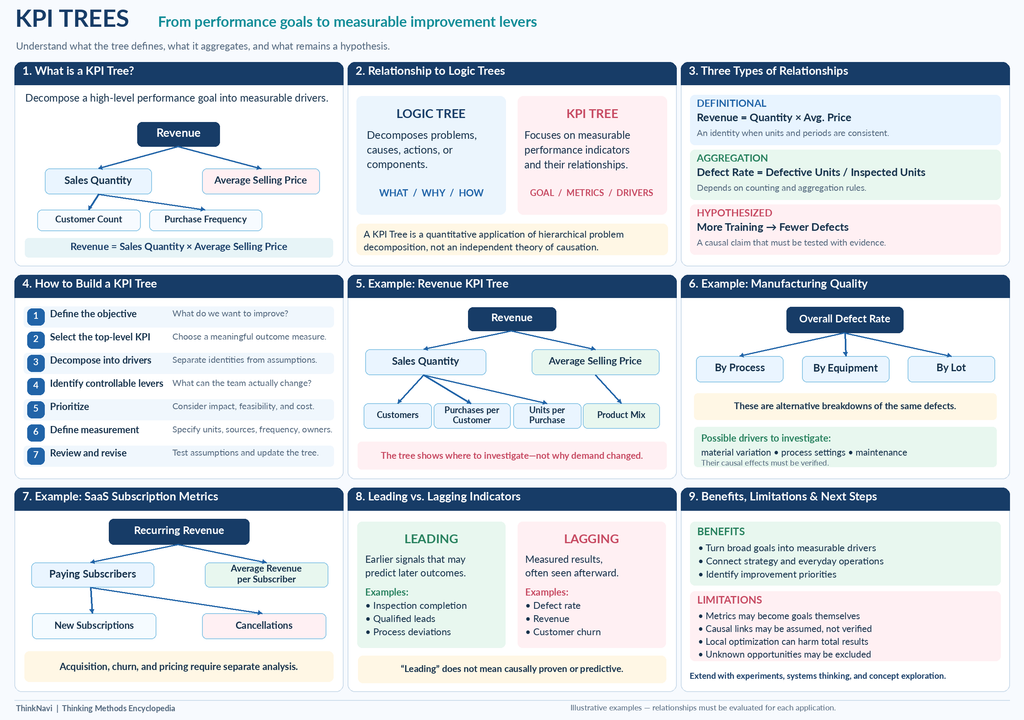
Definitional Relationships and Hypothesized Relationships
One of the most important issues in KPI Tree design is distinguishing different kinds of relationships among indicators.
At least three types should be considered.
| Relationship Type | Example | Characteristic |
|---|---|---|
| Definitional Relationship | Revenue = Quantity × Price | Established by definitions or mathematical formulas |
| Aggregation Relationship | Overall defect rate calculated from defect counts and inspected units | Depends on the data aggregation method |
| Hypothesized or Causal Relationship | More employee training reduces the defect rate | Requires investigation and empirical verification |
This distinction has major practical implications.
For example, decomposing revenue into quantity and average price is primarily a matter of definition.
However, a tree showing that customer satisfaction improves customer retention, which then increases profit, expresses a sequence of causal hypotheses.
Although the relationship may seem plausible, its validity depends on actual conditions.
Ignoring this difference can produce a visually convincing KPI Tree that contributes little to real-world performance improvement.
Leading Indicators and Lagging Indicators
When designing KPI Trees, it is useful to distinguish leading indicators from lagging indicators.
Lagging indicators describe outcomes that have already occurred.
Examples include revenue, operating profit, defect rates, and customer churn.
These indicators are important, but they may reveal a problem only after the outcome has occurred.
Leading indicators are measures believed to provide earlier information about future outcomes.
Examples include quotation requests, sales visits, initial response times, maintenance inspection completion rates, and deviations from process conditions.
KPI Trees often place outcome indicators at higher levels and leading indicators at lower levels.
This can help organizations respond to early warning signs rather than waiting until final results deteriorate.
However, whether an indicator is genuinely predictive must be investigated.
An indicator described as leading is not automatically a reliable predictor.
Its usefulness depends on the context, measurement method, and evidence connecting it to subsequent outcomes.
Selecting leading indicators based only on assumptions may simply increase the number of measurements without improving decision-making.
Practical Example 1 — A Revenue KPI Tree
A basic example involves decomposing revenue.
Revenue can be expressed as:
Revenue = Sales Quantity × Average Selling Price
Sales quantity can be decomposed further into customer count, purchasing frequency, and quantity purchased per transaction, provided those measures are consistently defined.
Average selling price may be examined through product mix, discount rates, and the proportion of premium products.
| Higher-Level Indicator | Lower-Level Indicators |
|---|---|
| Revenue | Sales quantity, average selling price |
| Sales quantity | Customer count, purchasing frequency, quantity per purchase |
| Average selling price | Product mix, discount rate, proportion of premium products |
This tree helps determine whether declining revenue is associated primarily with falling volume, lower prices, or both.
However, it does not explain why customer numbers have declined or why discounts have increased.
Those questions require additional investigation using Logic Trees, customer research, or causal analysis.
Practical Example 2 — A Manufacturing Quality KPI Tree
When the objective is improving manufacturing quality, possible top-level indicators include defect rate and yield.
A defect rate can be analyzed from several perspectives, such as production process, manufacturing lot, and equipment.
Related indicators may include deviations from process conditions, measurement abnormalities, and rework rates.
| Indicator | Related Indicators or Analytical Perspectives |
|---|---|
| Overall defect rate | Process-specific, lot-specific, and equipment-specific defect rates |
| Process-specific defect rate | Process deviations, measurement abnormalities, material lot variation |
| Rework rate | Operator errors, fixture problems, equipment setup changes |
An important distinction applies here.
Process-specific, lot-specific, and equipment-specific defect rates are alternative analytical breakdowns. They should not automatically be treated as additive components of the overall defect rate.
Similarly, an increase in equipment downtime may be associated with an increase in defects, but this is not a relationship established by definition.
Such relationships require verification through operational knowledge and relevant data.
Practical Example 3 — A SaaS KPI Tree
KPI Trees can also be applied to digital services such as ThinkNavi.
For example, subscription revenue can be analyzed in relation to the number of paying subscribers and average revenue per paying subscriber.
The subscriber base changes through new subscriptions, cancellations, and other account changes.
New paid subscriptions may be examined in relation to website visits, free registrations, and conversions from free to paid accounts.
| Higher-Level Indicator | Lower-Level Indicators or Related Measures |
|---|---|
| Subscription revenue | Paying subscribers, average revenue per subscriber |
| Paying subscribers | Beginning subscriber base, new paid subscriptions, cancellations |
| New paid subscriptions | Website visits, free registration rate, free-to-paid conversion rate |
| Cancellations | Churn rate, usage frequency, customer satisfaction |
This approach helps identify where potential users leave the acquisition process and which aspects of the service may need improvement.
For example, website traffic may be substantial while the number of paid conversions remains low.
The investigation can then consider whether the problem involves visitor relevance, product positioning, pricing, or other factors.
However, increasing website visits does not guarantee an increase in paid subscriptions.
Traffic quality, user needs, product value, and competitive alternatives may all influence conversion.
Furthermore, exact numerical decomposition requires consistent definitions of time periods, user cohorts, and conversion events.
Not every relationship shown in a practical KPI Tree is a mathematical identity.
Benefits of KPI Trees
KPI Trees offer several practical advantages.
First, they translate abstract objectives into measurable indicators.
Second, they help connect organizational goals with operational activities.
Third, they support prioritization by identifying indicators that may have a substantial impact on overall performance.
Fourth, they provide a shared representation that different departments can use when discussing objectives and responsibilities.
This can be particularly useful for operational teams.
A high-level financial or strategic objective may not provide sufficient guidance about what employees should do differently.
A KPI Tree can help connect that objective with more specific activities.
It can also support cross-functional coordination by clarifying how different departments contribute to shared outcomes.
Limitation 1 — Focusing Only on What Can Be Measured
KPI Trees are organized around quantitative indicators.
Consequently, they may encourage attention toward aspects of reality that are easy to measure while neglecting important qualitative factors.
Examples include the quality of research themes, customer trust, brand meaning, and organizational culture.
These factors may be difficult to quantify, or the available measures may fail to capture their essential characteristics.
Attempting to represent an entire business or research organization through a KPI Tree may therefore create a bias toward measurable activities.
This does not mean that quantitative measures are inappropriate.
It means that measurement should be understood as one form of representation rather than a complete description of reality.
Limitation 2 — When Indicators Become Objectives
A common problem in performance management occurs when the indicator itself becomes the objective.
For example, suppose a sales organization establishes the number of customer visits as a KPI.
Employees may respond by increasing the number of visits, even when those visits have little commercial value.
Similarly, if a customer support center places excessive emphasis on reducing call duration, employees may end conversations before customers’ problems have been adequately resolved.
This issue is commonly associated with Goodhart’s Law, which is often summarized as the idea that when a measure becomes a target, it may lose its usefulness as a measure.
The precise consequences depend on the circumstances, but the general problem is important.
Managing an indicator can change people’s behavior in ways that weaken the indicator’s relationship with the original objective.
KPI Trees should therefore be evaluated not only for numerical consistency but also for their possible behavioral consequences.
Limitation 3 — Overestimating Causal Relationships
Connections in a KPI Tree can create the impression that strong causal relationships exist among indicators.
However, some relationships may be statistical associations rather than causal mechanisms.
Others may be influenced by third variables.
For example, customer satisfaction and revenue may be correlated.
However, product quality or brand strength might influence both.
Similarly, employee training hours and defect rates may change together because equipment upgrades or process improvements occurred at the same time.
Causal claims should therefore be evaluated through appropriate evidence.
Statistical analysis, Design of Experiments, time-series comparisons, and direct operational observation may all contribute.
A KPI Tree should distinguish established relationships from assumptions that remain to be tested.
Limitation 4 — Encouraging Local Optimization
KPI Trees can make it easier to assign improvement targets to departments and individuals.
However, this can also encourage local optimization at the expense of overall organizational performance.
For example:
A manufacturing department may focus exclusively on yield.
A sales department may prioritize short-term revenue.
A development department may emphasize the number of new features released.
Each department may improve its own KPI while overall profitability or customer value deteriorates.
KPI Tree design should therefore consider alignment between higher-level and lower-level objectives.
It is necessary to examine whether improving a local indicator could produce undesirable consequences elsewhere in the system.
Limitation 5 — Limited Ability to Explore Unknown Opportunities
KPI Trees are particularly suited to managing and improving existing activities.
They are less suitable for exploring opportunities that have not yet been recognized.
For example, when searching for new R&D themes or unfamiliar markets, it may not be clear what should be measured.
A KPI Tree based on current revenue streams or customer classifications may provide little insight into opportunities arising from different technological fields.
In this sense, KPI Trees are generally stronger at managing known activities than discovering unknown possibilities.
Exploratory activities may require Concept Exploration, Concept Mapping, hypothesis generation, qualitative research, or other flexible methods.
Once an opportunity has been identified and developed into a concrete project, KPI Trees may become useful for monitoring its progress and outcomes.
KPI Trees and the Balanced Scorecard
A related management approach is the Balanced Scorecard.
The Balanced Scorecard organizes strategic objectives and measures across multiple perspectives, commonly including Financial, Customer, Internal Business Processes, and Learning and Growth.
KPI Trees are useful for decomposing particular objectives into related indicators.
The Balanced Scorecard emphasizes maintaining a broader balance among different dimensions of organizational performance.
The two approaches are not mutually exclusive.
KPI Trees can be used within individual Balanced Scorecard perspectives to clarify the relationships among indicators.
However, causal connections proposed in strategy maps or Balanced Scorecards also require evaluation rather than being assumed to hold universally.
AI-Assisted KPI Trees
LLMs and other AI technologies can support the design and review of KPI Trees.
For example, when a user specifies an objective, an AI system can suggest candidate top-level indicators and related lower-level measures.
It may also examine an existing KPI Tree and identify overlapping indicators, ambiguous definitions, measures that cannot be observed reliably, or relationships that appear to be unverified hypotheses.
When operational or time-series data are available, statistical analysis can help investigate relationships between lower-level and higher-level indicators.
However, an AI-generated KPI Tree should not be treated as automatically valid.
AI can generate plausible structures based on general patterns, but their relevance to a particular organization remains uncertain.
Each proposed relationship should be examined to determine whether it reflects a definition, an accounting relationship, a statistical association, or a causal hypothesis.
The resulting structure should also be evaluated against practical considerations such as data availability, operational feasibility, and organizational responsibilities.
KPI Trees in ThinkNavi
ThinkNavi treats KPI Trees as a practical thinking method that applies the principles of Logic Trees to quantitative performance management.
They are relevant to revenue, profitability, manufacturing quality, business efficiency, customer retention, and many other organizational objectives.
This makes KPI Trees a potential component of ThinkNavi Free.
For example, a relatively simple tool could allow users to enter a top-level objective and manually organize related indicators.
If each indicator could also store its definition, formula, unit, measurement frequency, responsible person, target value, and associated actions, the system could become more than a diagramming tool.
It could provide a structured framework for practical performance management.
Potential LLM-assisted capabilities include suggesting KPIs from objectives, comparing alternative decompositions, identifying ambiguous indicators, and distinguishing definitional relationships from hypothesized relationships.
Statistical findings and operational knowledge could also be associated with relationships in the tree.
Such capabilities could help transform a visually organized KPI Tree into a structure whose assumptions can be examined and tested.
These are potential directions for future development and do not imply that all such functions are currently available.
The essential purpose of a KPI Tree is not to create a hierarchy of numbers.
It is to clarify what the indicators mean, how they relate to organizational objectives, and which factors can be influenced to improve performance.
However, even the most carefully constructed KPI Tree may omit important factors that are difficult to measure or have not yet been recognized.
KPI Trees are powerful tools for managing and improving known activities, but they are not complete maps of reality. They should be used with a clear distinction between definitional, aggregation-based, and hypothesized relationships, while ensuring that managing indicators does not replace the original objectives.
Related Topics
- Logic Trees and Issue Trees — Breaking Down Problems and Identifying the Questions That Need Answers
- MECE — Logical Thinking Through Mutually Exclusive and Collectively Exhaustive Classification, and Its Limitations
- Problem Structuring — Breaking Down Problems, Understanding Relationships, and Finding Paths to Solutions
- Root Cause Analysis (RCA) — Understanding Why Problems Occur and Preventing Recurrence
- Decision Matrices
- Multivariate Analysis — Discovering Relationships and Structures Among Multiple Variables
- Design of Experiments (DOE) — Investigating Multiple Factors and Their Interactions Through Systematic Experimentation
- Qualitative and Quantitative Thinking — Two Perspectives on Understanding the World and Their Integration
- sConcept Maps — Representing Relationships Between Concepts and Understanding Knowledge Structures
- Systems Thinking | Interdependence and Change Over Time
- Causal Loop Diagrams | Understanding Feedback
- Design Thinking — From Human-Centered Problem Discovery to Ideation, Prototyping, and Testing
- Concept Exploration
References and Further Reading
- Robert S. Kaplan and David P. Norton, The Balanced Scorecard: Translating Strategy into Action, Harvard Business School Press, 1996.
- Wayne W. Eckerson, Performance Dashboards: Measuring, Monitoring, and Managing Your Business, Wiley, 2010.
- Bernard Marr, Key Performance Indicators (KPI): The 75 Measures Every Manager Needs to Know, Financial Times/Prentice Hall, 2012.
- John Doerr, Measure What Matters, Portfolio, 2018.
- Charles Conn and Robert McLean, Bulletproof Problem Solving: The One Skill That Changes Everything, Wiley, 2018.
- Barbara Minto, The Minto Pyramid Principle: Logic in Writing, Thinking and Problem Solving, Minto International, 1996.