

A Logic Tree is a method for decomposing problems or subjects into smaller elements and representing their structure and relationships in a hierarchical tree diagram. By breaking a large problem into manageable parts, it becomes easier to organize the analysis, identify what needs to be investigated, and consider possible actions.
An Issue Tree is a related method that focuses specifically on decomposing a central problem into questions that must be answered to reach a conclusion or make a decision.
For example, suppose a manufacturing company wants to improve profitability. It can organize the problem into elements such as revenue, costs, equipment utilization, and product mix. It can then formulate questions such as “What has changed?”, “Why has it changed?”, and “What improvements are possible?”
This decomposition helps transform a broad challenge into specific investigations and analytical tasks.
Logic Trees and Issue Trees are widely used in management consulting, business improvement, and strategic planning. They are also frequently introduced as representative methods of logical thinking.
However, decomposing a problem into increasingly detailed elements does not necessarily lead to a correct conclusion.
If the original problem is incorrectly defined, even a carefully constructed tree may fail to address the issue that actually needs to be resolved.
Furthermore, real-world problems often involve interactions among multiple factors that cannot be adequately represented through a simple hierarchy.
The value of a Logic Tree lies in decomposing a problem, while the value of an Issue Tree lies in clarifying the questions that need answers. Neither method automatically guarantees that the problem has been framed correctly or that the resulting conclusions are valid.
The Difference Between Logic Trees and Issue Trees
Logic Trees and Issue Trees are not always distinguished consistently. In business practice, the terms are sometimes used almost interchangeably.
A useful distinction is to treat Logic Trees as a general approach to hierarchical decomposition and Issue Trees as a particular application focused on decomposing questions.
| Perspective | Logic Tree | Issue Tree |
|---|---|---|
| Main Purpose | Organize the structure of a problem or subject | Identify the questions that must be answered |
| Starting Point | A subject, problem, or objective | A central question requiring an answer |
| Main Elements | Components, possible causes, actions, etc. | Questions, issues, matters requiring verification |
| Decomposition | Hierarchical decomposition from whole to parts | Decomposition of broad questions into more specific questions |
| Main Outcome | Organization of problem components and analytical subjects | Clarification of investigation and verification requirements |
| Typical Applications | Information organization, cause analysis, action planning | Strategic analysis, research planning, decision support |
For example, decomposing Manufacturing Costs into Material Costs, Labor Costs, and Manufacturing Overhead is an application of a Logic Tree intended to organize the components of a subject.
By contrast, starting with the question “Should manufacturing costs be reduced?” and developing questions such as “Which costs are increasing?”, “Which costs can be reduced?”, and “What would be the impact on quality?” is an Issue Tree approach.
The important distinction is not the terminology but what is being decomposed.
Breaking down numerical values, generating possible causes, considering alternative actions, and identifying questions requiring answers are different activities.
Each requires an appropriate form of decomposition.
The Basic Structure of a Logic Tree
A Logic Tree generally begins with a higher-level item that branches into several lower-level elements.
The top level represents the subject or problem being analyzed.
This is decomposed into related components, which may then be divided into more detailed elements.
For example, manufacturing costs might be represented through the following hierarchy.
| Level | Content |
|---|---|
| Top Level | Manufacturing Costs |
| First Level | Material Costs, Labor Costs, Manufacturing Overhead |
| Second Level | Components of material costs, labor costs, and overhead |
| Third Level | Individual materials, operations, equipment-related expenses, etc. |
However, when this classification is used for actual cost accounting, the allocation of costs must follow clearly defined accounting rules and costing methods.
If the same expense is included in multiple categories, the sum of the components may exceed the actual total.
For some analytical purposes, a distinction between Fixed Costs and Variable Costs may be more useful.
Thus, different Logic Trees can be created for the same subject using different decomposition criteria.
The appropriate decomposition depends on the purpose of the analysis.
Three Representative Types of Logic Trees
Logic Trees are commonly explained through three types corresponding to the questions What, Why, and How.
These are practical categories rather than three strictly independent theoretical systems.
| Type | Central Question | Purpose |
|---|---|---|
| What Tree (Component Decomposition) | What does the subject consist of? | Identify components and structure |
| Why Tree (Cause Analysis) | Why did the problem occur? | Explore possible causes |
| How Tree (Action Development) | How can the objective be achieved? | Develop possible solutions and actions |
Understanding these differences is important.
If different types of relationships are mixed within a single tree without clarification, the meaning of the branches may become ambiguous.
1. What Trees — Decomposing a Subject into Components
A What Tree organizes the components or elements of a subject.
For example, company profit can be expressed as:
Profit = Revenue − Costs
Revenue can then be decomposed as:
Revenue = Sales Quantity × Average Selling Price
Here, Average Selling Price is defined as revenue divided by the quantity sold during the relevant period.
Such mathematical decomposition establishes explicit relationships between higher-level and lower-level values, provided the definitions are consistent.
For example, when revenue declines, the analysis can identify whether sales quantity decreased, the average selling price fell, or both changed.
However, mathematical decomposition does not itself explain why those changes occurred.
If sales quantity declined, the underlying reasons might involve competitors, changes in demand, or insufficient production capacity.
These possibilities require separate investigation.
A What Tree is useful for identifying what has changed, but understanding why it changed requires additional analysis.
2. Why Trees — Exploring Possible Causes
A Why Tree is used to investigate why a problem occurred.
For example, when product defect rates increase, possible causes might be organized according to Materials, Equipment, Processing Conditions, and Measurement Methods.
Equipment-related causes might include machine wear, temperature control problems, or reduced positioning accuracy.
This approach is closely related to Root Cause Analysis (RCA), 5 Whys, and Cause-and-Effect Diagrams.
However, items included in a Why Tree are initially candidate causes.
For example, adding a branch labeled Temperature Control Failure beneath Increased Defect Rate does not establish that temperature control actually caused the defects.
That relationship must be investigated using equipment logs, measurements, production histories, and other evidence.
Furthermore, problems may arise from combinations of multiple factors.
A simple tree structure may not adequately represent these interactions.
3. How Trees — Developing Possible Solutions
A How Tree explores ways of achieving a particular objective.
For example, the objective “Reduce Equipment Downtime” might lead to several approaches:
- Prevent equipment failures.
- Detect failures earlier.
- Reduce recovery time after failures.
Failure prevention could then be developed into more specific measures, such as improving maintenance plans, managing component lifetimes, or modifying equipment design.
However, not every proposed action needs to be implemented.
Preventive measures and recovery measures address different stages of equipment failure.
They may be alternatives, complementary measures, or components of a broader strategy.
Their relationships must be clarified.
Furthermore, the contribution of each measure should be evaluated in terms of feasibility, cost, expected benefits, and risks.
Issue Trees — Decomposing Questions That Need Answers
An Issue Tree begins with a central question.
Suppose a company faces the following decision:
“Should we make additional investments in our existing product business?”
Answering this question requires examining future demand, competitive strength, investment requirements, profitability, and other considerations.
The central question can therefore be decomposed into subordinate questions.
| Central Question | Subordinate Questions |
|---|---|
| Should we make additional investments? | Is future demand expected to be sufficient? |
| Same | Can the company maintain or strengthen its competitive position? |
| Same | Will the investment generate an acceptable return? |
| Same | Are the technological and business risks acceptable? |
| Same | Should this investment take priority over other opportunities? |
The question “Is future demand expected to be sufficient?” can be further decomposed into questions about market size, customer purchasing behavior, competing products, and alternative technologies.
An Issue Tree is therefore not simply a method of dividing a problem into smaller parts.
Its central purpose is to identify the questions that must be answered to support a decision and clarify what information is needed to answer them.
What Is an Issue?
The word issue can refer to a problem, question, point of dispute, or matter requiring attention.
In management consulting, it is often used more specifically to describe a question that needs to be resolved for decision-making or problem-solving.
For example, Market Environment is a subject for investigation, but it is not itself a question.
By contrast:
“Will the market grow over the next three years?”
“Will major customers switch to substitute products?”
These questions provide clearer guidance about what should be investigated.
An Issue Tree is therefore often more useful when its elements are expressed as answerable questions rather than merely as lists of nouns.
However, formulating a question does not automatically produce an answer.
The relevance of the question and the information required to evaluate it must still be considered.
Issue Trees and Hypothesis Trees
A related method is the Hypothesis Tree.
Whereas an Issue Tree organizes questions, a Hypothesis Tree organizes statements that represent possible answers or explanations.
For example:
| Issue Tree | Hypothesis Tree | |
|---|---|---|
| Top Level | Should we enter a new market? | Entering Market X is a promising opportunity |
| Subordinate Element 1 | Is sufficient demand available? | Potential customer demand is expanding |
| Subordinate Element 2 | Can our technology provide a competitive advantage? | Our technology has advantages over competing solutions |
| Subordinate Element 3 | Can the business generate sufficient profit? | Expected sales volume can support the required profitability |
An Issue Tree identifies what needs to be investigated.
A Hypothesis Tree organizes possible conclusions or explanations that need to be evaluated.
The two approaches can be combined.
For example, an initial question may lead to a hypothesis, and that hypothesis may generate additional questions about how it can be tested.
However, formulating a hypothesis should not mean deciding the conclusion in advance.
Evidence contradicting the hypothesis and alternative explanations should also be examined.
How to Construct a Logic Tree
There is no single mandatory procedure for constructing a Logic Tree.
However, the following activities provide a useful starting point.
| Step | Main Activity | Important Consideration |
|---|---|---|
| 1. Define the subject | Clarify what is being analyzed | Is the problem appropriately scoped? |
| 2. Identify the purpose of decomposition | Select What, Why, How, or another approach | Avoid mixing different relationship types |
| 3. Develop the first level | Identify major components or perspectives | Examine the classification criteria |
| 4. Expand subordinate levels | Decompose important components further | Do not make detail an end in itself |
| 5. Check gaps and overlaps | Use MECE as a reference | Do not exclude information that does not fit |
| 6. Review relationships | Clarify how higher and lower levels are related | Do not assume causes or effects without evidence |
| 7. Select investigation priorities | Focus on important branches | Establish reasons for prioritization |
| 8. Revise the structure | Update the tree in response to findings | Avoid becoming committed to the initial decomposition |
How Far Should a Problem Be Decomposed?
In principle, a Logic Tree can be expanded through many levels.
However, greater detail does not necessarily make an analysis more useful.
For example, manufacturing costs could be decomposed into individual operations and components.
Yet some of those details may have little relevance to the current decision.
Conversely, if a particular cost category is found to be central to the problem, more detailed examination of that category may be necessary.
There is no requirement to expand every branch to the same depth.
A more practical approach is to develop each branch only as far as needed to support the relevant decisions and concentrate further analysis on important areas.
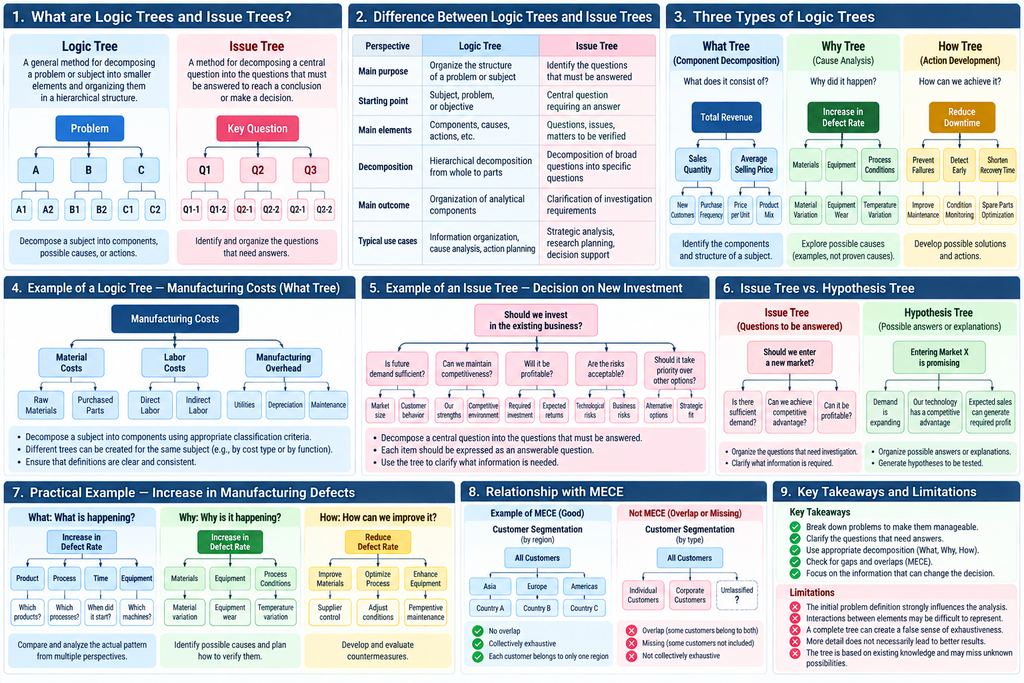
Practical Example — Investigating an Increase in Manufacturing Defects
Suppose the dimensional defect rate for a particular product increases at a manufacturing plant.
The problem can be examined through What, Why, and How Trees.
The following is a hypothetical example intended to illustrate the methods.
What — What Is Happening?
First, the actual pattern of defects must be investigated.
For example, defect rates can be compared according to product, process, production period, equipment, and manufacturing lot.
| Analytical Perspective | Question |
|---|---|
| Product | Which products or components account for most defects? |
| Process | At which processing stages do defects occur? |
| Time | When did the defect rate begin to increase? |
| Equipment | Are defects associated with particular machines? |
| Manufacturing Lot | Are defects concentrated in particular lots? |
These are different classification perspectives.
A defective product may simultaneously be associated with a particular product type, process, period, machine, and lot.
These perspectives should not be treated as mutually exclusive categories at the same hierarchical level.
Instead, the data should be analyzed from different perspectives according to the purpose.
Why — Why Is It Happening?
Next, possible causes are investigated.
Candidates might include changes in material properties, processing conditions, equipment thermal deformation, or measurement procedures.
The analysis should identify not only candidate causes but also the evidence needed to test them.
| Causal Hypothesis | Evidence to Examine |
|---|---|
| Variation in material properties is contributing to defects | Material lots, property tests, production records |
| Changes in processing temperature are contributing to defects | Temperature logs and defect occurrence times |
| Equipment thermal deformation is contributing to defects | Equipment temperature, operating time, dimensional measurements |
| Measurement conditions have changed | Measuring instruments, calibration records, measurement procedures |
At this stage, it is important not to assume that there is only one cause.
For example, defects may occur only under a particular combination of material characteristics and processing temperature.
If so, the investigation must consider interactions between factors rather than merely evaluating individual branches independently.
How — How Can the Problem Be Improved?
Once the relevant causes have been investigated, corrective measures can be developed.
If processing temperature variation is identified as a significant factor, possible actions might include improving temperature control, strengthening monitoring, or revising processing conditions.
However, each measure involves constraints such as cost, implementation time, production capacity, and possible effects on quality.
Several measures may need to be combined.
Distinguishing What, Why, and How helps prevent confusion between observed conditions, hypotheses about causes, and proposed corrective actions.
Practical Example — Exploring New R&D Themes
Logic Trees and Issue Trees can also support research and development planning.
Suppose a company wants to investigate the following question:
“Can we apply our existing materials technology in new industries?”
An Issue Tree might include the following questions.
| Central Question | Subordinate Questions |
|---|---|
| Can we expand into new industries? | What functions and properties does our technology provide? |
| Same | Which industries or applications require those functions? |
| Same | Does our technology offer advantages over existing alternatives? |
| Same | Can relevant technological and regulatory requirements be satisfied? |
| Same | Is the opportunity commercially viable? |
This Issue Tree is useful for organizing an investigation.
However, one fundamental question remains.
How should the industries and applications to be investigated be selected in the first place?
Suppose the company’s existing customers are concentrated in the automotive and electronics industries.
Further decomposition of these two industries may not reveal potential applications in healthcare, food production, construction, or other fields.
Similarly, focusing only on the company’s current product applications may obscure the broader functions and technological principles that its technology provides.
R&D exploration may therefore require abstracting the functions and characteristics of a technology and investigating relationships with unfamiliar fields.
Once new application candidates have been identified, an Issue Tree can help evaluate technical compatibility, market potential, and feasibility.
Issue Trees are especially useful when the questions requiring investigation are reasonably well understood. When the possibilities themselves remain unknown, an additional process of discovering new questions may be necessary.
The Relationship Between Logic Trees and MECE
MECE (Mutually Exclusive, Collectively Exhaustive) is frequently introduced as an important principle for constructing Logic Trees.
MECE requires categories to avoid overlap and collectively cover the subject being classified.
For example, when aggregating transactions by geographic region, each transaction should be assigned to one region, and every relevant transaction should be included.
In such cases, satisfying MECE is important.
However, the branches of Why Trees and How Trees do not necessarily represent mutually exclusive subsets.
For example, manufacturing defects may involve both materials and processing conditions.
Likewise, effective corrective actions may require combining equipment improvements with changes to operating procedures.
Requiring every branch to be mutually exclusive can conceal important relationships spanning multiple categories.
MECE is a principle for evaluating gaps and overlaps in classification and decomposition.
It does not mean that every real-world problem must be divided into mutually exclusive causes or actions.
Furthermore, a classification may satisfy MECE while excluding important problems that lie outside its initial scope.
Classification consistency and the appropriateness of the original problem definition must therefore be evaluated separately.
Logic Trees and Root Cause Analysis
Why Trees are closely related to Root Cause Analysis (RCA).
However, the two are not equivalent.
A Why Tree is a representation for organizing candidate causes hierarchically.
RCA is a broader investigative process that may include collecting evidence, developing causal hypotheses, verifying those hypotheses, implementing corrective measures, and evaluating their effectiveness.
A Why Tree can therefore be one tool used within RCA.
For example, possible explanations for equipment shutdown might be organized into Power Supply, Cooling System, and Control System.
However, determining which factors actually contributed to the event requires examining equipment records and physical evidence.
If failure depends on several conditions occurring together, methods such as Fault Tree Analysis (FTA) may also be appropriate.
The objective of RCA is not simply to list possible causes.
It is to understand the mechanisms responsible for a problem and use that understanding to prevent recurrence.
Logic Trees and KPI Trees
A KPI Tree represents relationships between objectives and key performance indicators in a hierarchical structure.
For example, revenue may be decomposed into Sales Quantity and Average Selling Price.
Sales Quantity may then be examined in relation to customer numbers, purchasing frequency, and other indicators.
KPI Trees can therefore be understood as an application of hierarchical decomposition to quantitative performance management.
However, it is important to distinguish mathematical relationships from hypothesized causal relationships.
For example:
Revenue = Sales Quantity × Average Selling Price
This is a mathematical relationship based on how the indicators are defined.
By contrast:
“Higher employee satisfaction leads to higher customer satisfaction, which increases revenue.”
This is a causal hypothesis that requires empirical verification.
Treating these relationships as equally certain can produce misleading interpretations of KPI structures.
KPI Trees should therefore distinguish definitional or mathematical relationships from those that depend on empirical evidence.
Logic Trees and Concept Maps
Logic Trees and Concept Maps both represent relationships among elements or concepts visually.
However, their basic structures differ.
A Logic Tree develops hierarchically from higher-level items to lower-level items.
A Concept Map emphasizes meaningful relationships between concepts, often expressed through explicit linking phrases.
For example, suppose a Logic Tree organizes a manufacturing problem into Materials, Processing Conditions, Equipment, and Quality.
If material characteristics interact with processing conditions to affect quality, a simple hierarchy may not adequately represent those relationships.
A Concept Map can express propositions such as:
“Material characteristics influence the appropriate range of processing conditions.”
“Processing conditions affect product quality.”
| Perspective | Logic Tree | Concept Map |
|---|---|---|
| Basic Structure | Hierarchical tree | Network of conceptual relationships |
| Main Purpose | Decomposition, issue organization, action development | Understanding and representing knowledge relationships |
| Relationship Direction | Generally progresses from higher to lower levels | Can represent relationships in multiple directions |
| Relationship Meaning | Depends on whether the tree addresses What, Why, How, etc. | Explicitly expressed through linking phrases |
| Interactions | May be difficult to represent | Can represent multiple relationships among concepts |
However, adding a relationship to a Concept Map does not prove that it exists.
Nor are Concept Maps universally superior to Logic Trees.
For organizing simple structures or tasks, a Logic Tree may be clearer and more efficient.
The appropriate method depends on the nature of the problem.
Limitation 1 — The Decomposition Framework Shapes the Analysis
The initial decomposition criteria used in a Logic Tree strongly influence the subsequent investigation.
For example, when examining declining revenue, decomposition into Price and Sales Quantity can clarify the numerical changes.
However, the underlying reasons may involve customer behavior, competitive products, or technological developments.
Furthermore, the company’s real challenge may not be restoring revenue to its previous level but reconsidering its business direction.
In such a situation, reframing the problem may be more important than decomposing the original problem in greater detail.
Logic Trees make problems easier to manage through decomposition, but they do not guarantee that the initial problem definition is appropriate.
Limitation 2 — Interactions Between Elements Are Difficult to Represent
In a conventional tree structure, an item typically has one immediate parent.
However, real-world factors may influence multiple outcomes or interact with one another.
For example, changes in processing temperature may influence material deformation.
The deformation may increase mechanical loads on equipment, which may then change the processing conditions further.
Such feedback cannot be adequately expressed through a simple Logic Tree.
Similarly, separating causes into independent branches may conceal phenomena arising from combinations of factors.
Methods such as Concept Maps, Causal Loop Diagrams, and Design of Experiments may be necessary to examine relationships and interactions.
Limitation 3 — The Illusion of Exhaustiveness
Logic Trees can create an impression that all relevant possibilities have been considered because the diagram appears orderly and complete.
This impression may be particularly strong when MECE has been applied.
However, exhaustiveness under MECE applies only within the defined scope and classification criteria.
For example, classifying all existing customers by industry may successfully cover the current customer base.
It does not establish that potential customers or unfamiliar applications have been discovered.
Likewise, listing all currently recognized candidate causes does not prove that no unknown causes exist.
Organizing known information exhaustively is different from discovering every unknown possibility.
Failing to recognize this distinction can allow a Logic Tree to restrict the range of thinking unnecessarily.
Limitation 4 — Greater Detail Does Not Guarantee Better Results
As a problem is decomposed, the number of tasks and questions increases.
However, more detailed decomposition does not necessarily produce better understanding.
Suppose a strategy project generates several hundred investigation items.
Examining all of them may require considerable time and expense.
Yet many may have little effect on the eventual decision.
Conversely, if a critical assumption is incorrect, investigating numerous secondary details may not improve the conclusion.
The important question is therefore not only how far a problem can be decomposed but which information is most likely to change the decision.
This consideration is especially important when constructing Issue Trees.
Limitation 5 — Logic Trees Begin with Existing Knowledge
The branches that can be constructed in a Logic Tree depend on the knowledge and experience of the person creating it.
For example, an R&D specialist may be capable of constructing a very detailed tree of technologies and applications within a familiar technical field.
However, the specialist may be unable to identify branches involving technological principles or applications outside that field.
Expanding the existing tree into greater detail does not necessarily lead to exploration of unknown domains.
Addressing this limitation may require gathering new information, investigating technologies from different industries, or abstracting the characteristics of a problem to explore it from alternative perspectives.
Logic Trees are useful for organizing familiar problems.
However, when the objective is to discover unknown problems or new concepts, they may need to be combined with other exploratory methods.
AI-Assisted Logic Trees and Issue Trees
LLMs and other AI technologies can assist with the development of Logic Trees and Issue Trees.
For example, when a user describes a problem in natural language, AI can suggest ways to decompose it according to What, Why, or How.
AI may also identify overlapping branches, unclear classification criteria, or perspectives that have not been considered.
For Issue Trees, it can suggest the information and evidence needed to answer individual questions.
However, AI-generated trees may involve several problems.
First, a plausible decomposition based on general knowledge may not be appropriate for a particular company or operational situation.
Second, candidate causes generated by AI are not necessarily actual causes.
Third, even a neatly organized tree may omit important questions.
Fourth, AI may reproduce familiar classification frameworks without adequately exploring unfamiliar possibilities or cross-domain relationships.
Effective AI assistance should therefore extend beyond automatically generating diagrams.
| AI-Assisted Function | Description |
|---|---|
| Problem Decomposition | Break down a problem using What, Why, How, or other perspectives |
| Classification Review | Identify gaps and overlaps using MECE as a reference |
| Issue Formulation | Transform vague topics into questions that can be investigated |
| Hypothesis Generation | Develop alternative explanations and possible answers |
| Evidence Organization | Connect questions and hypotheses with relevant information |
| Verification Tracking | Distinguish confirmed findings from untested assumptions |
| Alternative Decompositions | Propose different ways of framing and organizing the problem |
| Exploration of Unknown Perspectives | Investigate possibilities not represented in the existing tree |
An especially important principle is not to treat the first AI-generated tree as a final structure.
When new information emerges or an alternative problem definition proves more appropriate, the tree itself should be revised.
Logic Trees and Issue Trees in ThinkNavi
ThinkNavi treats Logic Trees and Issue Trees as fundamental methods for problem decomposition and issue organization.
Logic Trees provide a relatively simple hierarchical representation that many users can understand without extensive training.
They also provide a natural introduction to related methods such as MECE, Problem Structuring, Root Cause Analysis, and KPI Trees.
For ThinkNavi Free, a possible implementation would allow users to enter problems or objectives and create and edit trees using What, Why, and How structures.
Allowing users to attach investigation findings, hypotheses, evaluations, and corrective actions to individual branches could extend the functionality beyond diagram creation into practical problem-solving support.
Potential LLM-assisted functions include generating decomposition proposals, organizing issues, identifying gaps and overlaps, generating hypotheses, and suggesting additional investigations.
When a hierarchical tree cannot adequately represent the relationships involved, users could move to other representations such as Concept Maps.
When exploration beyond existing problems or technological fields is necessary, the workflow could incorporate Concept Exploration.
These are possible directions for future development and do not imply that all such capabilities are currently available.
Logic Trees and Issue Trees can improve the efficiency of analysis and decision-making by decomposing complex problems.
However, reality cannot always be represented adequately through a single hierarchical structure.
Furthermore, no matter how detailed a tree becomes, important problems or possibilities may still exist outside its boundaries.
A Logic Tree is a tool for decomposing problems, and an Issue Tree is a tool for organizing the questions that need answers. The objective is not to produce a perfectly organized tree, but to identify the questions that matter, evaluate them using appropriate evidence, and reconsider the problem itself when necessary.
Related Topics
- Problem Structuring — Breaking Down Problems, Understanding Relationships, and Finding Paths to Solutions
- MECE — Logical Thinking Through Mutually Exclusive and Collectively Exhaustive Classification, and Its Limitations
- Logical Thinking — Building Sound Arguments, Communicating Reasoning, and Achieving Mutual Understanding
- Critical Thinking | Examining Claims and Evidence
- Root Cause Analysis (RCA) — Understanding Why Problems Occur and Preventing Recurrence
- Five Whys | Exploring Root Causes by Repeatedly Asking “Why?”
- sCause-and-Effect Diagram (Fishbone Diagram) — Systematically Organizing Factors That May Contribute to a Problem
- KPI Trees — Decomposing Performance Goals and Identifying Levers for Improvement
- Mind Maps | From Associative Thinking to AI-Powered Summarization and Information Structuring
- Concept Maps — Representing Relationships Between Concepts and Understanding Knowledge Structures
- The KJ Method | Building Meaningful Structures from Fragmented Information
- Systems Thinking | Interdependence and Change Over Time
- Causal Loop Diagrams | Understanding Feedback
- Decision Matrix | Comparing Alternatives Across Multiple Criteria and Evaluating Decision Validity
- Induction, Deduction, and Abduction — Discovering Patterns, Drawing Conclusions, and Generating New Hypothese
- The Scientific Method and Falsifiability — Generating Hypotheses and Testing Them Critically
- Design of Experiments (DOE) — Investigating Multiple Factors and Their Interactions Through Systematic Experimentation
- Concept Exploration
References and Further Reading
- Barbara Minto, The Minto Pyramid Principle: Logic in Writing, Thinking and Problem Solving, Minto International, 1996.
- Barbara Minto — The Minto Pyramid Principle
- Charles Conn and Robert McLean, Bulletproof Problem Solving: The One Skill That Changes Everything, Wiley, 2018.
- McKinsey & Company — How to Master the Seven-Step Problem-Solving Process
- McKinsey & Company — Problem Solving Is for Everyday Life, Too!
- American Society for Quality (ASQ) — What Is a Tree Diagram?
- ASQ — Seven New Management and Planning Tools
- ITmedia — Logic Trees: Information Management Glossary (Japanese)
- Hanako Teruya and Keiko Okada, Logical Thinking (Japanese), Toyo Keizai, 2001.
- Kazuto Ataka, Start with the Issue (Japanese), Eiji Press, 2010.
- Horst W. J. Rittel and Melvin M. Webber, “Dilemmas in a General Theory of Planning,” Policy Sciences, 4, 1973, pp. 155–169.